“Winds in the east, mist coming in.
Like somethin’ is brewin’ and ’bout to begin.
Can’t put me finger on what lies in store,
But I feel what’s to happen all happened before”
—Mary Poppins
Talking Points
- We are expecting a significant increase in stock market volatility over the next few months
- We believe this will be driven by several factors including the forthcoming US elections
- Back in the UK, we suggested in our last note that Labour might cynically try to claim they “didn’t know” how bad the UK’s finances were. They did, they just chose to ignore it and mislead voters that they could fix it
- We look at possible tax options that Labour could pursue
- And we ask: is there any point to have a Chancellor of the Exchequer anymore?
Former British Prime Minister Harold Wilson famously once said, “a week is a long time in politics.” It can be a long time in markets too: since we started drafting this note we have gone from the attempted assassination of Donald Trump to Biden’s resignation and the apparent coronation of Kamela Harris. A candidate in our opinion nearly as flawed as Biden.
We don’t think the market will take this well, in her failed Presidential run she was significantly to the left of Biden. Also markets generally dislike uncertainty plus the US Democratic Primary next month in Chicago could be an ugly re-run of 1968 further adding to the noise.
We also saw a turn in markets, with tech darlings such as ASML and Taiwan Semiconductor aggressively selling off despite strong earnings. This is what we describe as a “news failure” in markets, meaning that despite news that should have caused a strong reaction in the security, the opposite happened.
Some of the Tech Stars Have Started to See Increasing Volatility Despite Great Results, July 2024
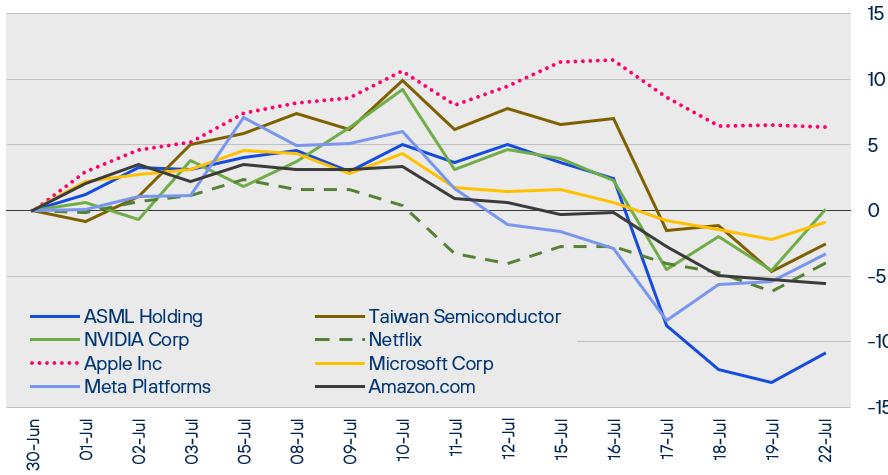
Source: Henderson Rowe and FactSet.
This can happen for a number of reasons: the stocks were too aggressively priced relative to prospects (“priced to perfection” in market parlance); or simply the fact that markets are made on the margin and there were no more marginal buyers at that price level ahead of the summer lull.
There are other “top of the market” indicators too, such as Ken Fisher of Fisher Investments selling a significant stake of his company to Middle East investors. Fisher Investments is a growth-orientated fund manager that is heavily invested in tech stocks and Ken Fisher knows a lot more about the long-term prospects of his company than the buyers do, so if it was so good why is he selling? We see this sort of behaviour repeatedly over time, such as Glencore’s IPO at the top of the last commodity cycle and some of the PE firms just before the 2008 crash.
“Practically perfect people never permit sentiment to
muddle their thinking.”
—Mary Poppins
Away from this, Q2 played out as expected, with the afterglow of the US’s massive Q4 liquidity injection continuing to support markets. As we have indicated previously, we have been reducing your equity exposure by selling into this but even we were surprised by the level of support, with the US deficit increasing by over $400bn in just 4 months. To put this into perspective: to keep its economy turning over, the ADDITIONAL borrowing by the United States over a 2-year period is more than the ENTIRE existing national debt of the UK. This is unsustainable and – worse – reckless.
US Deficits Are Accelerating
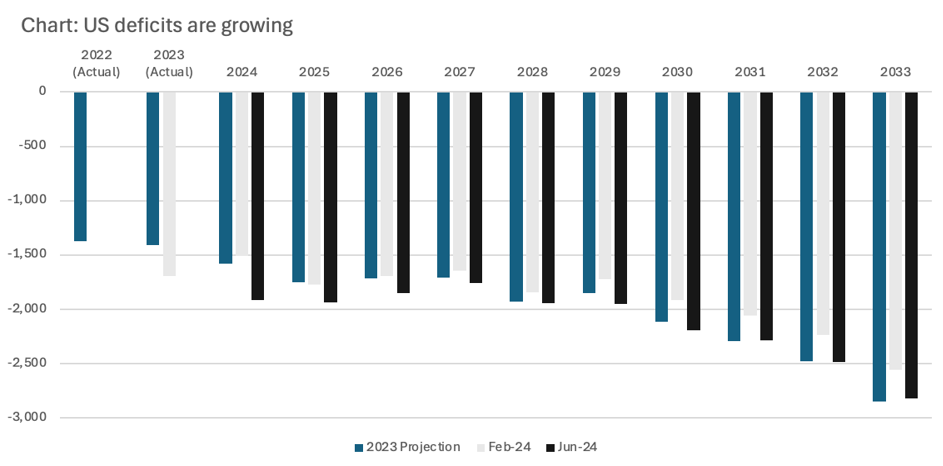
Source: CBO and Henderson Rowe.
This dragged on the US dollar and weakened our performance in Q2 though given the massive amount of speculative long trades in GBP we expect this to be temporary.
With elections in the US fast approaching we expect a volatile Q3 ’24 and probably another injection of liquidity before the US election by the current administration which should present us with a selective buying opportunity. US companies have started to report weakening demand and sticky costs, and whoever wins the next US election is likely to have a tricky few years ahead of them.
“The first lesson of economics is scarcity: There is never enough of anything to satisfy all those who want it. The first lesson of politics is to disregard the first lesson of economics.”
—Thomas Sowell
Politics
Like economics, society is fragmenting. As we have previously mentioned, we expected more political upheaval in Europe and so the French elections have proved: France is effectively without a government and Macron has very limited ability to do anything outside of Defence and Foreign Affairs. Effectively their government is in a stalemate so no radical change can be expected but, unfortunately, at the same time the EU is expecting France to rein back its expenditure.
Understandably the bond market has started to ask for a higher risk premium on French government debt and other weaker EU economies.
French Debt Now Trades in Line with Spain
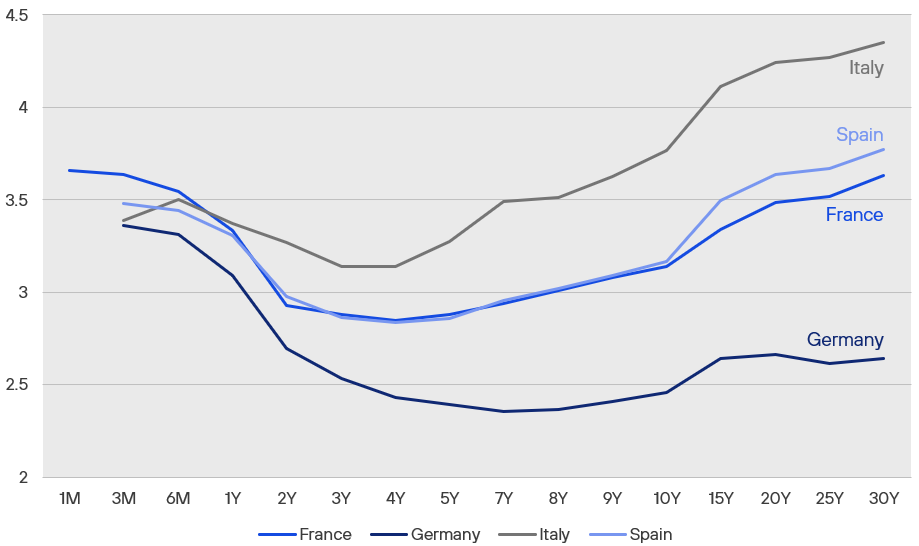
Source: Henderson Rowe and Bloomberg.
At time of writing, Joe Biden has just stepped down from being the US Presidential candidate leaving Kamala Harris as the candidate. Unfortunately, should Harris be nominated she isn’t much of an improvement. Harris failed to progress even with fellow Democrats in her own Presidential run in 2019/2020. Her strong views on gender and trans ideology are likely to resurface and not play well with the wider US electorate. More important were her tax views which included equalising income and CGT tax, raising US Corporation Tax to 35%, introducing a financial transaction tax and an “income based premium” tax of 4% to pay for Medicare for all.
“That’s a piecrust promise. Easily made, easily broken.”
—Mary Poppins
This brings us to the recent UK election. As we outlined in our last note, we expected Labour to win and probably with a big majority. And now it has come to pass, we can look at the Labour manifesto and other comments in more detail.
The first point is that Labour is, as we suspected, now trying to distance itself from some of their prior statements by trying to claim they didn’t know how bad the UK finances were. This is an obvious untruth: most of the UK’s finances are a matter of public record. Additionally, Labour would have had the assistance of the Civil Service this year as a normal part of the election process.
What is the point of Rachel Reeves?
The second point we would make is that Rachel Reeves has stated the Office of Budget Responsibility (OBR) now has a formal “handbrake” on UK financial policy. Aside from the fact the OBR have been repeatedly wrong, the question now has to be asked: if the OBR effectively controls fiscal policy whilst the Bank of England controls monetary then what is the point of Rachel Reeves?
This is a long way from her bold claims that due to being a junior analyst at the Bank of England she knows “how to run a successful economy.” Whether you do or don’t is now immaterial, and given the outsourcing of thinking to a quango, your role appears to be: after the F9 key has been pressed on the OBR’s excel spreadsheet, you get to make some minor policy choices.
Brace for impact–taxes likely
“Read my lips: no new taxes.”
—George H.W. Bush, 1988 (taxes rose)
“There are no additional tax rises needed beyond the ones that I’ve set out.”
—Rachel Reeves, 2024 (TBD)
Will Labour have to raise taxes? Allegedly no…
It’s theoretically possible for the Labour government not to raise taxes. Indeed, Rachel Reeves has already said this and there are several factors that could still come to the rescue, including stronger economic growth, a recovery in public sector productivity, and savings on the welfare bill.
…but we think they will have to…
That said, we just think for reasons discussed it’s unlikely. First, many of its voters believe Labour is somehow going to magically fix services. Labour has partly boxed itself in by promising to follow existing fiscal rules on expenditure. Or in other words they are going to try and not spend too much relative to income although, as we have already highlighted, they have started to distance themselves from this.
Reeves also opened the door on big public sector pay increases over the weekend of the 20th July. This is despite the UK public sector being the least productive part of the economy, so more money into the part of the economy that is least likely to grow without massive structural reform. Worryingly this echoes one of the big mistakes of the Blair administration which was the huge increases in public sector funding without any attempts at productivity reform.
Finally, taxes are going up anyway since Labour doesn’t plan to increase any of the reliefs for inflation so more people will be dragged into higher tax brackets.
…and so does Tony Blair
Additionally, even the Tony Blair Institute has predicted that taxes will have to rise by more than £50bn by the end of the Parliament to meet all Labour’s various goals and stabilise the debt. Additionally, we suspect they will find that some of the tax-raising policies they have already announced (VAT on private schools, higher taxes on Non-doms and accelerating the green energy transition) will not raise the revenues they expect, and we would not be surprised if they actually proved to be counterproductive.
Next, Labour’s calculations also assume that there will be no recession. Admittedly we have been surprised at the resilience of the economy so far, but it seems a stretch to expect no slowdowns over the lifetime of the next Parliament.
So what taxes could they raise?
The first thing to acknowledge is they could raise any of them. As we have repeatedly stated, they are already being disingenuous about the state of public finances so there is no reason to think they will be faithful to anything else they have committed to.
Putting that to one side, if we assume that Labour plans come unstuck and they are obliged to raise taxes, what can they do?
Let’s start what Labour ruled out. The party has said that, aside from the tax increases already announced, it will not be necessary to raise taxes to pay for the various initiatives in the manifesto and ruled out increases in “taxes on working people” in any circumstances.
The party has gone further and specifically ruled out any increases to the rates of personal income tax, national insurance, VAT, and corporation tax – or any new form of “wealth tax.”
Major Sources of UK Tax Revenue, 2024-2025
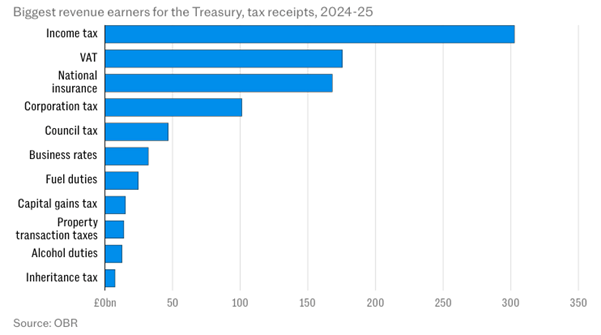
Source: OBR.
Labour’s promise not to raise taxes on “working people” is meaningless. It could just be interpreted as a commitment not to raise taxes on income from employment. But in practice, many “working people” also pay tax on income from capital or savings. That said, let us make the optimistic assumption they hold to this.
As you can see from above, by ruling out those taxes Labour would have to radically change some of the lesser revenue generators to make a difference.
While no part of the current government, former Labour leader Neil Kinnock has talked about equalising capital gains tax with income tax recently, which is likely to be extremely self-defeating. We think they are likely to start being more particular on what qualifies for CGT relief, possibly with an emphasis on promoting UK investments over overseas ones. Labour has made some comments regarding private equity taxation. She wishes to remove the carried interest loophole and equalise it unless there was clear evidence of capital at risk.
Another area might be to increase the headline rate but reintroduce indexation, something that Gordon Brown removed “as too difficult to calculate.” apparently unaware of the advent of personal computers.
The next key area where Labour could pick on is small business taxation because the tax gap – what small companies should be paying vs what they are paying – has grown. So, we expect a crackdown and a possible removal of some loopholes. The stamp duty charge on commercial property and use of offshore entities would be an obvious one, but again unlikely to generate that much revenue in total.
Small Businesses Have the Highest Estimated Tax Gap
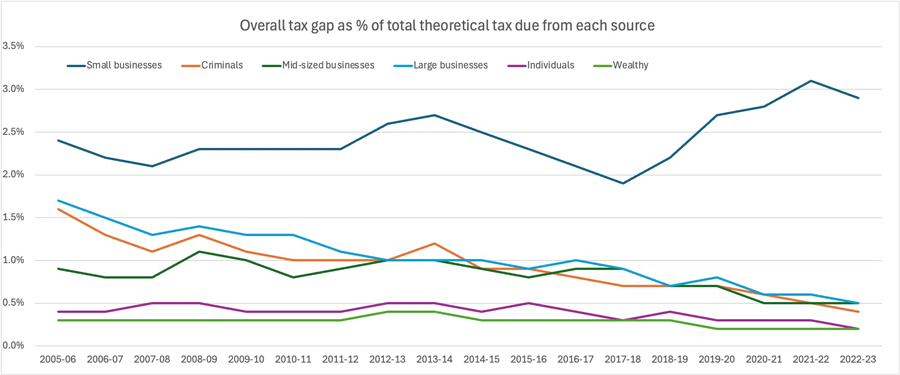
Source: Tax Policy Associates.
Related to this is the removal of Inheritance Tax Relief on family businesses. Indeed, we have seen the Family Business Association starting to lobby against this, but it is this area of inheritance tax where we see the most likely changes.
An area that seems to be repeatedly flagged is taxing unspent amounts in defined contribution pensions. By drawing down on earnings outside your pension, the DC pension increasingly becomes an attractive IHT vehicle. The Treasury seems to be determined to claim some of this.
Another area would be the treatment of woodland or AIM shares, but the latter is a key link for revitalising the City so changing treatment on that or EIS would likely be counterproductive.
There is also the area of indirect taxes. Labour has pledged to copy the EU and introduce a Carbon Border Adjustment Mechanism (CBAM), which would act as a tariff on a range of imports. Also to fund their ill-thought out “green energy” plans Labour will effectively be raising the cost of energy to compensate.
Whatever happens rather than panicking we suggest waiting for now and seeing what comes out of the financial review and subsequent budget and adjusting then.
“Anything can happen if you let it.”
—Mary Poppins
As we have repeatedly stated we believe we in the middle of a bigger structural changes in the market. In our opinion the cycle has been extended due to the massive cash infusions by the US. We suspect we haven’t seen the end of these, and it seems unlikely to us there wouldn’t be an attempt to keep US assets afloat before the election.
Given all that is going on the biggest challenge for us is to keep touch with the market whilst managing risk. As you know we are maintaining our performance, but we are not taking large positions in the same crowded stocks as everybody else. The valuation of many assets seems very aggressive. That is not to say they cannot go higher.
Ultimately the law of large numbers will work against these firms. By this it is much harder for a $3 trillion company to double in value than a $3 million company. At some point financial gravity is likely to reassert itself. When that happens, we cannot tell so we will be opportunistic in our investment before then.
That said, we are getting more excited about opportunities as the market dislocates. We see great opportunities in fixed income and in volatility linked products. We expect the next 6 months to be volatile one but a potentially a very profitable one.
After markets set a high bar going into 2024—pricing in half-a-dozen rate cuts by year-end—the last six months have seen investors walking back those lofty expectations, with all eyes on a US central bank seemingly content to kick the can down the road toward “greater confidence” in disinflation’s progress. Even so, with mounting evidence of a cooling economy hinting at a soft landing and September Fed pivot, investors were confident enough in Q2 to bid equities to new highs. Below, we share data-driven views on stories we’re following and offer our outlook for markets entering the second half.
Equities
After disconcerting data on inflation through the first three months of the year dashed earlier hopes of plentiful Fed rate cuts in 2024, the second quarter brought better news, with prices seeming to resume a disinflationary trend and signs that the US economy might be cooling. The resulting rise in confidence that the US central bank might stick a soft landing, combined with ongoing investor enthusiasm toward stocks with exposure to the AI theme, led equity indices higher in Q2 (see Figure 1). US shares posted particularly strong performance, rising 4.3% for the quarter, with growth stocks dominating. Developed Markets outside the US were modestly negative over the last three months, returning -0.4%, weighed down by losses among Eurozone stocks and continued depreciation of the Japanese yen, whose slide against the greenback in Q2 was enough to turn a 1.6% gain on the TOPIX index over the quarter to a -4.4% loss in dollar terms. Despite stocks in China slipping by -1% in the second quarter on worries its economic rebound might be losing steam, shares across the rest of the Emerging Markets—which tend to be particularly sensitive to good news on US interest rates—put the global EM basket up 5.1% for the quarter, solidly outperformed their DM counterparts.
Figure 1: Equity Market Performance, Returns as of June 30, 2024
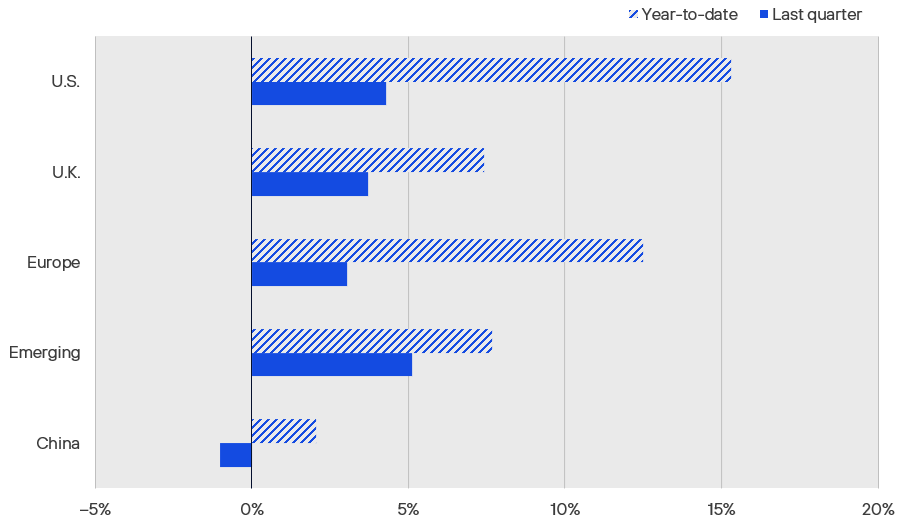
Source: S&P 500 (USD), FTSE All-Share (GBP), EURO STOXX 50 (EUR), MSCI Emerging Markets (USD), and CSI 300 (CNY), via Bloomberg.
Taking stock of equity performance at this year’s halfway mark, the US shares that still make up the bulk of most globally diversified investors’ equity portfolios have gained an impressive 15.3% year-to-date in 2024—a far cry from the median 2% full-year return sell-side analysts were predicting last December. We all know that past performance is no promise of future results, but if history does repeat, the last three decades of data suggest it will be a good second half for stocks in the S&P 500, for which gains through June have tended to predict further appreciation over the latter six months of the year (see Figure 2). It turns out that when there’s a US Presidential election—and one happens to be coming up in November—the odds have been particularly good, with the S&P 500 posting positive performance from July through December in eight out of the last ten election years. The two elections in that period that witnessed US stocks down in the second half also sported first-half losses.
Figure 2: Positive First-Half S&P 500 Returns Historically Bode Well for Rest of Year
It was a stellar first half of 2024 for US stocks, with shares in the S&P 500 Index climbing just over 15% year-to-date, through the end of June, making thirty-one new record closing highs along the way: half a dozen more than the average number posted over the last fifteen full years. Does that tell us anything about likely performance over the next six months? Going back to 1990—a small sample, to be sure—there’s at least a hint that US equities could be in for good times in the second half, with the S&P 500 tending to do better from July through December in years with positive performance in the first two quarters. Investors will be hoping this year plays out like 2021, whose H1 return was nearly identical to this year’s, and whose second half brought another 11%.7% of upside..
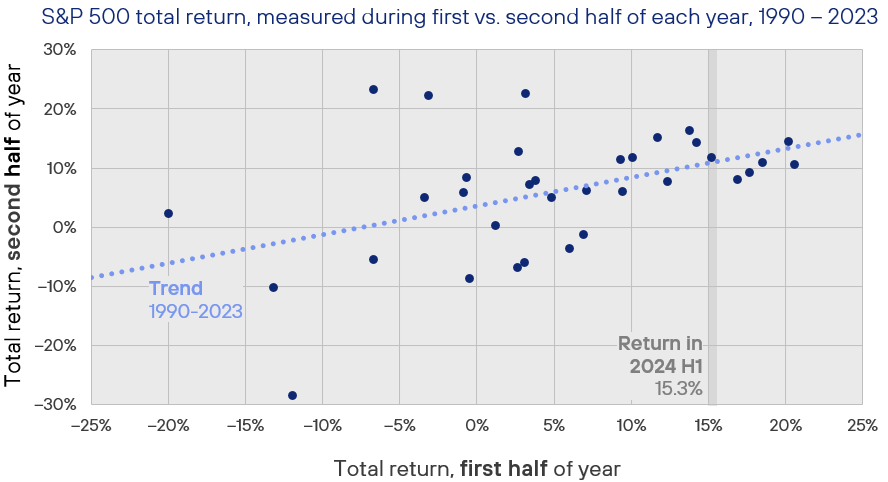
Source: Rayliant Research, as of June 30, 2024.
Notwithstanding the stellar performance of equities so far this year, one aspect of the rally that’s left many investors more than a little concerned is the concentration of those gains among a relatively small set of high-profile tech stocks. The bull market’s breadth did improve somewhat in the first quarter, but retreated again in Q2, as stocks in the vaunted ‘Magnificent 7’ cohort once again trounced the rest of the market (see Figure 3). Indeed, with AI darling Nvidia’s ascendence to the $3-trillion-market-cap club in June, there were three firms in that elite set, whose weight in the S&P 500 index totaled around one-fifth of the index; by comparison, even at the height of the late-90s Internet bubble, the top three constituents weighed in at less than 10% of the index. Similarly, the top ten holdings in the S&P 500 account for around 35% of weight today, markedly higher than the top ten stocks’ 27% footprint at the peak of dot-com mania. That doesn’t necessarily mean US shares are in a bubble—earnings growth has surely been impressive—though we do believe investors will benefit from some diversification outside the Mag 7 when the rally broadens out to touch more of the market.
Figure 3: Stocks in Magnificent 7 Put Remaining 493 Names to Shame in Q2
While a broad set of US stocks participated in the market’s first-quarter rally, we witnessed that breadth give way in Q2 to gains much more concentrated in a handful of stocks: the usual suspects in the ‘Magnificent 7’, for example, five of which scored double-digit gains in the first half of the year. Driven by a resurgence of enthusiasm for the AI mega trend captivating investors since ChatGPT arrived in late 2022—not to mention a continuation of Nvidia’s stellar financial outperformance—shares in big tech have registered disproportionate gains year-to-date. Indeed, through the end of June, Mag 7 stocks have meaningfully outpaced the remaining 493 names in the S&P 500, adding 32.8% in the first half, versus a still-very-respectable 8.3% for those hundreds of ‘also-ran’ listings.
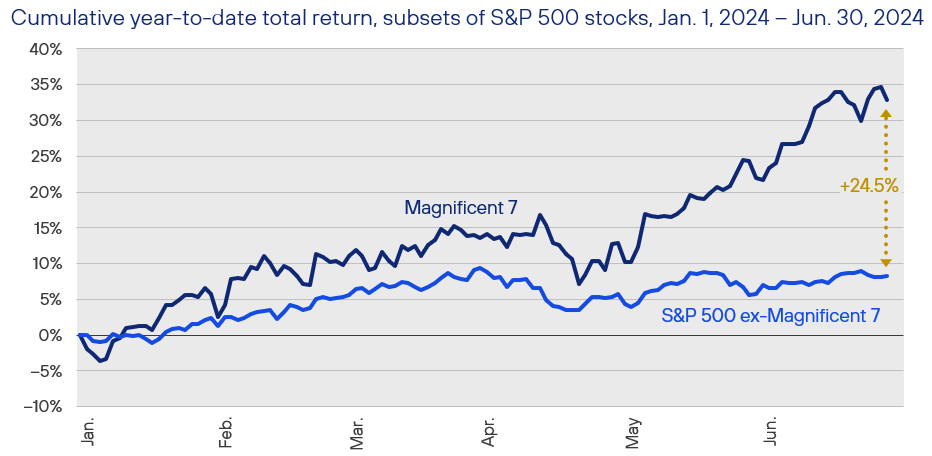
Source: Rayliant Research, as of June 30, 2024.
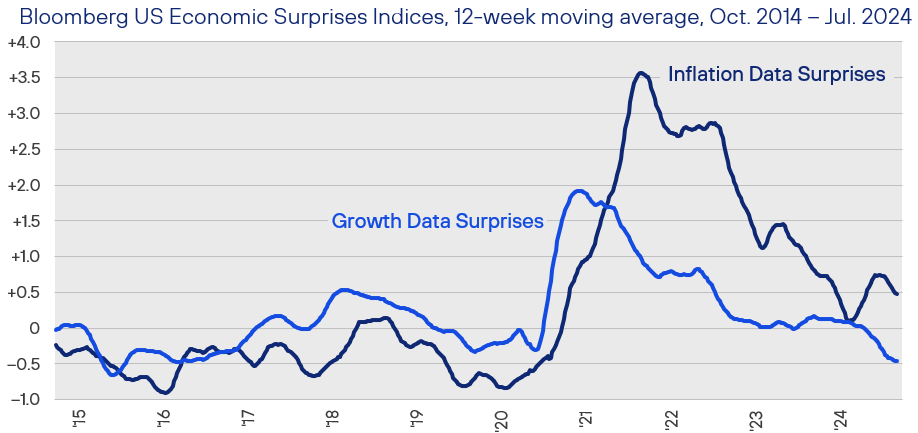
And what could lead to such a rotation from mega-cap tech stocks to the rest of the S&P 500—or even small-cap stocks? The aforementioned soft landing couldn’t hurt: a rising macro tide that would lift all ships. That outcome seemed somewhat less probable at the end of Q1, after a series of uncomfortably hot inflation prints to start the year, though inflation surprises moderated as the quarter wore on (see Figure 4). On the other side of the Fed’s dual mandate, cooling in the US labor market apparent toward the end of the Q2, along with slowing consumer spending and overall economic growth, contributed to investors’ renewed optimism around a smooth resolution to the current monetary policy cycle. We tend to believe one of the biggest threats to a continuation of the first half rally in risk assets is divergence apparent in the chart below. That could come from upside risk to inflation, still somewhat above the Fed’s 2% target, but also a sharper downturn in the economy. With respect to the latter, we note that recent data from the Federal Reserve Bank of San Francisco show Americans’ pandemic savings ran out at the end of Q1 (see Figure 5). That will undoubtedly make it harder for US consumers’ insatiable spending to continue propping up the economy in the face of record-high rates.
Figure 4: Fed’s Work Complicated in 2024 by Diverging Data on Growth and Inflation
On the US macroeconomic front, two key themes emerged in the first half of the year. Inflation surprises tended to be positive, with fears that price pressures could reaccelerate in Q1 rising on the back of a string of hotter-than-expected CPI prints, moderating a bit as data came in closer to expectations during Q2. Perhaps more concerning—and revitalizing fears of dreaded ‘stagflation’—was a series of surprises in the other direction on the growth dimension. Signs the will of US consumers might be finally buckling, a first-quarter GDP well below economists’ expectations, along with data showing a cooling job market have further complicated matters for a US Federal Reserve hoping to see a stronger trend toward disinflation before initiating rate cuts.
Source: Rayliant Research, E-Mini S&P 500 Index futures contracts data via CME Group, CFTC, as of April 17, 2024.
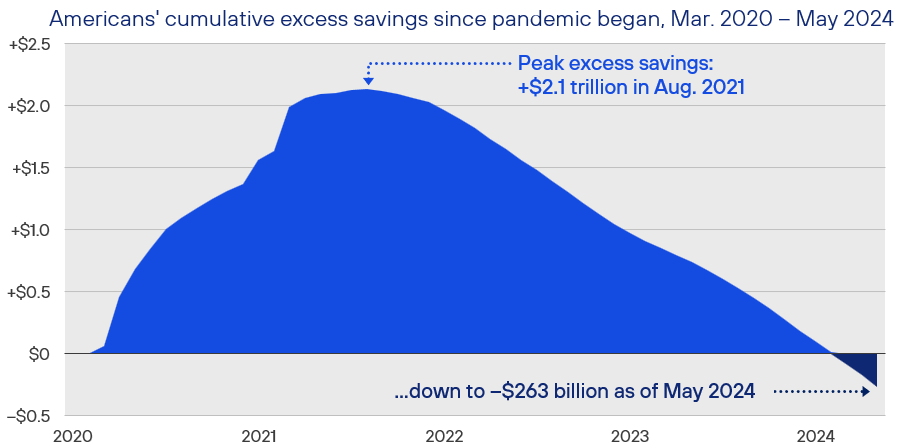
Figure 5: Dwindling Pandemic-Era Savings Could Account for Softening Spending
Since the Fed started tightening rates in 2022, American consumers have deservedly taken much of the credit for a surprisingly strong US economy. Part of the reason US households were able to keep spending—and corporate earnings were able to keep climbing—was the massive hoard of excess savings Americans accumulated during the first year of the pandemic. According to calculations by the San Francisco Fed, that cash pile topped out at $2.1 trillion in August 2021, and consumers have been drawing down on it steadily ever since. In a worrying sign for future spending, the same data show excess savings went negative in March. That could account for indications, in retails sales data and on Q1 earnings calls, that American households are finally tightening their belts.
Source: Rayliant Research, San Francisco Fed, as of May 31, 2024.
Fixed Income
Not surprisingly, global bond investors’ eyes were squarely on the world’s central banks in Q2, seeking any indication that over two years of tight monetary policy might be giving way to more accommodative conditions. The Bank of Canada and European Central Bank obliged with well-telegraphed rate cuts in early June, while data showing a cooler US economy rolled in as the quarter drew to a close: all hopeful signs for a broader pivot in central bank policy. Unfortunately, given how exuberant yield traders had been at the outset of 2024—not to mention major volatility on the political front adding to bond market uncertainty in some regions—fixed income investors faced mixed results for the quarter (see Figure 6).
Figure 6: Fixed Income Market Performance, Returns as of June 30, 2024
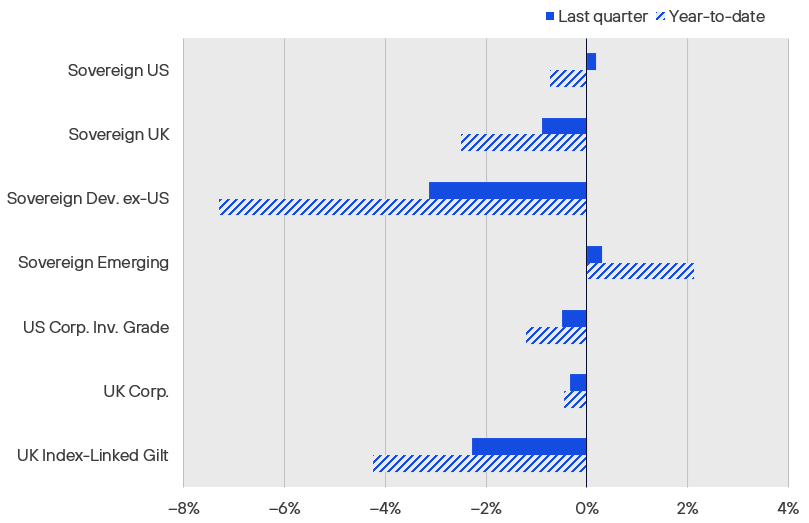
Source: ICE US Treasuries Core, FTSE Actuaries UK Conventional Gilts, S&P Int. Sov. ex-US, JPMorgan EMBI Global Core, iBoxx USD Liquid Inv. Grade, Markit-iBoxx GBP Liq. Corp., Bloomberg UK Gov. Inflation-Linked All Mat., expressed in USD, except for UK indices in GBP, via Bloomberg.
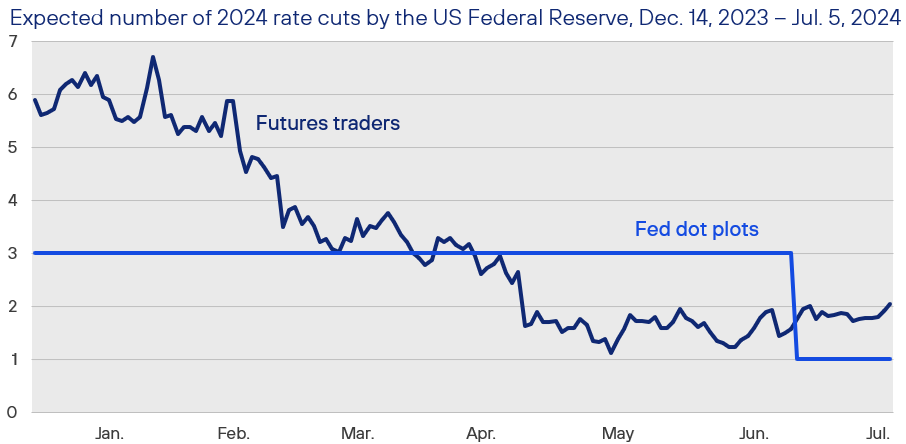
With so much debate in recent months as to whether the Fed would find themselves comfortable enough to cut rates by the end of Q3, it would be easy to forget that as recently as early January, the question among futures traders was whether it would be six or seven cuts by year-end. Never mind the fact that the Fed’s December 2023 dot plot showed just three reductions in its benchmark rate for the full year. Fast forward six months, and the FOMC has reduced its anticipated degree of easing in 2024 to just a single cut, while markets are still relatively optimistic—but now price in just two moves by the Fed through December (see Figure 7). Consistent with macro conditions having improved by quarter-end, though global money managers polled by Bank of America in June still voted ‘higher inflation’ as the greatest tail risk to their portfolios, the degree of fear that prices will reaccelerate has waned since May (geopolitical risk and US election uncertainty, by contrast, have been gaining ground).
Figure 7: Traders Have Gradually Tempered Expectations for Fed Cuts in 2024
When last December’s FOMC dot plots revealed the US central bank intended to begin easing over the next twelve months, with a median expectation of three rate cuts, traders reacted with more than a little enthusiasm, pricing at least six rate reductions into December 2024 Fed funds futures. We were much more skeptical, and our concerns proved out, as first-quarter signs of sticky inflation made it impossible for the Fed to pivot in the first half of the year. Traders reluctantly revised downward their hopes for a handful of cuts, settling on a more conservative one or two moves by the Fed as the quarter drew to a close. At their June meeting, members of the FOMC caught up, penciling into their Q2 dot plots one solitary median cut to occur sometime in the second half.
Source: Rayliant Research, US Federal Reserve, CME Group, as of July 5, 2024..
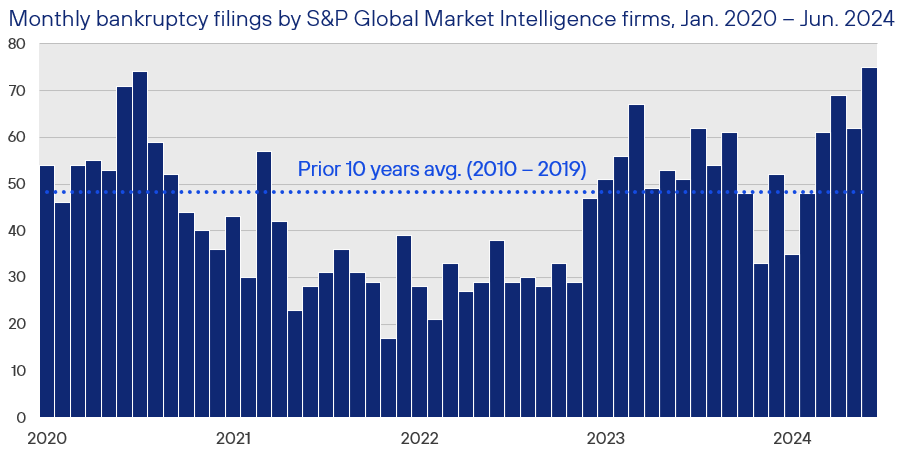
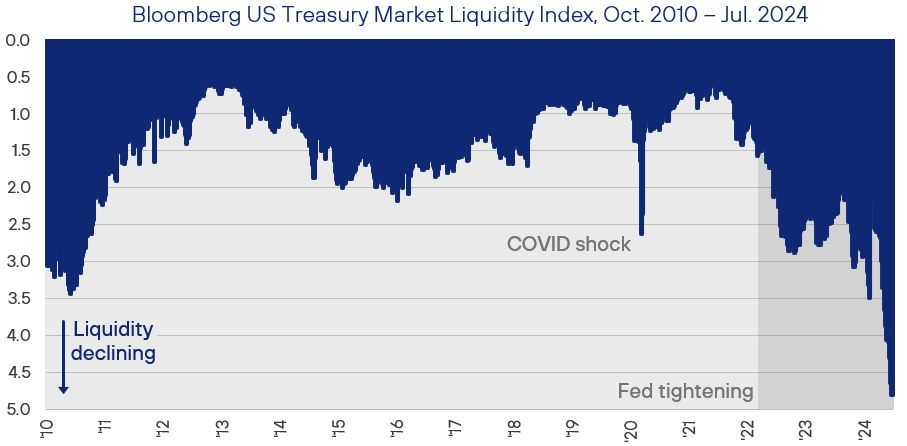
Investors in high yield bonds will be especially sensitive to hawkish shifts in the timeline for easing, as the implications of higher-for-longer Fed policy are particularly pronounced among companies on the edge of survival. A report on corporate bankruptcies in the first half of the year by S&P Global Market Intelligence illustrates how serious that situation is becoming, with the number of large firms failing by June hitting a level not reached since 2010 in the wake of the Great Recession (see Figure 8). As S&P researchers noted, that jump in bankruptcy filings over the last few months likely reflects discouraged managers recognizing rate cuts won’t come fast enough and finally giving in. Uncertainty in the fixed income markets—not only with respect to when easing arrives, but also in terms of Washington’s precarious fiscal circumstances and political drama as the November election nears—has also shown up in the Treasury market, where liquidity is worse, by some measures, than at any time since 2008, amidst the Global Financial Crisis (see Figure 9).
Figure 8: Inevitable Impact of ‘Higher-For-Longer’ Showing Up in US Bankruptcy Filings
With interest rates holding at a 23-year high since last July, consumers and businesses are feeling the pain. That anguish is evident in data on large corporate bankruptcies tracked by S&P Global Market Intelligence, with a count of companies throwing in the towel during June surpassing highs last hit amidst the COVID shock at the beginning of 2020, while the number of first-half bankruptcies tallied its highest mark since 2010, which saw many firms still struggling in the shadow of the Great Recession. Indeed, each of the last four months, beginning in March 2024, has featured a bankruptcy count exceeding the pre-pandemic average. Such stats underscore the risk of taking stock market strength for granted, as years of tight Fed policy take an increasing toll on the US economy.
Source: Rayliant Research, Bank of International Settlements, NBER recessions shaded, as of March 31, 2024.
Figure 9: Liquidity Rut in Treasury Trading Points to Major Market Uncertainty
Searching for signs of stress in the global financial system, an obvious place to turn is the market for US Treasury securities, weighing in at a size of roughly US$27 trillion. Bloomberg’s US Treasury Market Liquidity Index attempts to spot trouble by looking at bonds whose prices deviate from fair value: what should be an uncommon occurrence in a market as actively traded as this one. Based on this measure, Treasury liquidity is lower than at any other point since the Global Financial Crisis (though still way off those lows). Rather than signaling a malfunctioning market on the verge of crisis, we see such stats as suggesting ample uncertainty on everything from the path of inflation and Fed policy to America’s fiscal condition and the implications of a potentially chaotic US election cycle.
Source: Rayliant Research, Bloomberg, as of July 7, 2024.
Alternatives
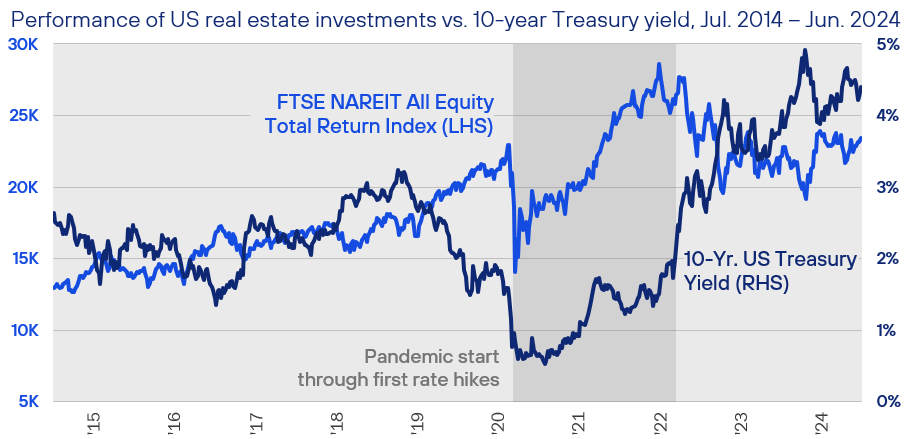
As was the case in the first quarter, real estate investments gave up ground in Q2, while a broad basket of commodities rose modestly (see Figure 10). Though we continue to view many REITs as having solid fundamentals and operating performance, the hawkish shift in sentiment toward Fed cuts throughout the last six months has weighed on a sector especially sensitive to interest rates (see Figure 11). While that relationship broke down a bit in the early days of the pandemic, industry group NAREIT recently reported that the rolling one-year correlation between REIT and 10-year Treasury total returns crept up to –0.7 in 2024, a level not seen in over two decades. That relationship has been a headwind to real estate investments so far this year, though it should turn into a tailwind when rate cuts finally arrive.
Figure 10: Alternatives Performance, Returns as of June 30, 2024
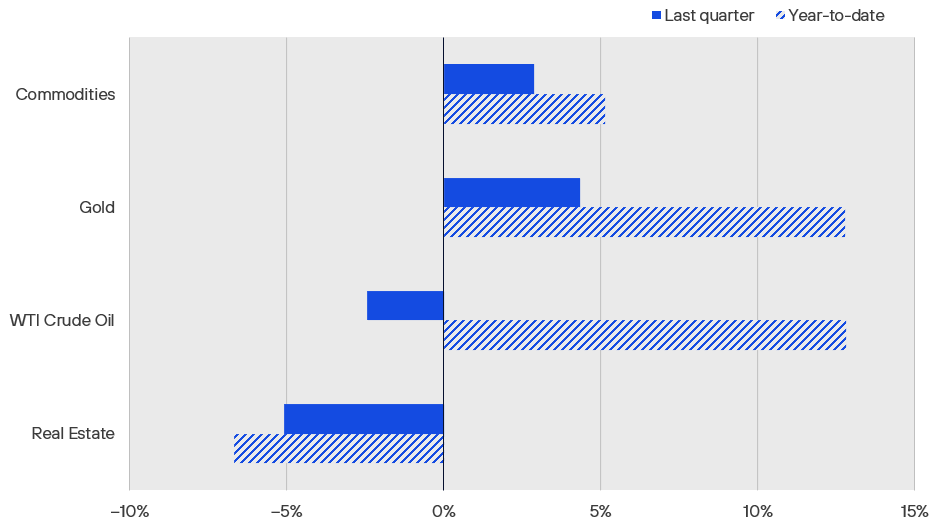
Source: Bloomberg Commodity Index, Gold Spot, WTI Crude, iShares International Developed Real Estate ETF, all expressed in USD, via Bloomberg.
Figure 11: REITs’ Rate Sensitivity Should Also Factor When Fed Pivots
Given the obvious adverse impact of rate hikes on property investments, waning sentiment toward a Fed pivot has weighed on real estate so far in 2024. Indeed, a FTSE NAREIT index tracking US real estate investment trusts has traced an approximate mirror image of moves in 10-year US Treasury yields for much of the last decade. The period from the beginning of the pandemic to the onset of Fed tightening was an exception, as REITs clawed their way back from a deep COVID drawdown at the same time bonds priced in concern about the end of easy Fed policy—and, eventually, the impact of growing price pressures. This plot says little about improving REIT fundamentals over the last few years, but it does explain why we expect eventual cuts to lift their valuations.
Source: Rayliant Research, as of June 30, 2024.
While the relationship between real estate performance and interest rates is obvious, investors may be less familiar with the ramifications of Fed policy for commodity prices. To that end, the research team at Goldman Sachs recently performed an investigation into behavior of commodity sectors and a range of individual commodities to policy-induced changes in Treasury yields, finding that Fed cuts are, on average, a positive for the broad commodity basket, provided they come in a non-recessionary environment (see Figure 12). In particular, they tipped industrial metals and crude oil as likely gainers if a soft landing prevails, especially as time wears on and the effects of easing work their magic on demand. While our allocations to commodities are often strategic, meant to diversify against inflationary and geopolitical shocks, we believe lower rates and a rebound in global demand could yield solid returns for commodities amidst tight supply for many resources today.
Figure 12: Commodities—Especially Metals—Likely to Benefit When Rate Cuts Come
Although investors’ hopes of plentiful rate cuts and a swift start to easing have soured over the course of the year, we suspect that whenever that pivot does come, the accommodative conditions it brings will provide a nice boost to global manufacturing—and, consequently, the commodities that power industrial production around the world. A nice bit of analysis by Goldman Sachs earlier this year estimated the price impact of a 100-bps drop in yield on US Treasuries, assuming no recession, based on data from past Fed policy cycles. Consistent with our thinking on the benefits of cuts, they found though a diversified commodity basket would likely perform well, the biggest gains would be in industrial metals: the sector which happened to contribute most to commodities’ positive Q2 return.
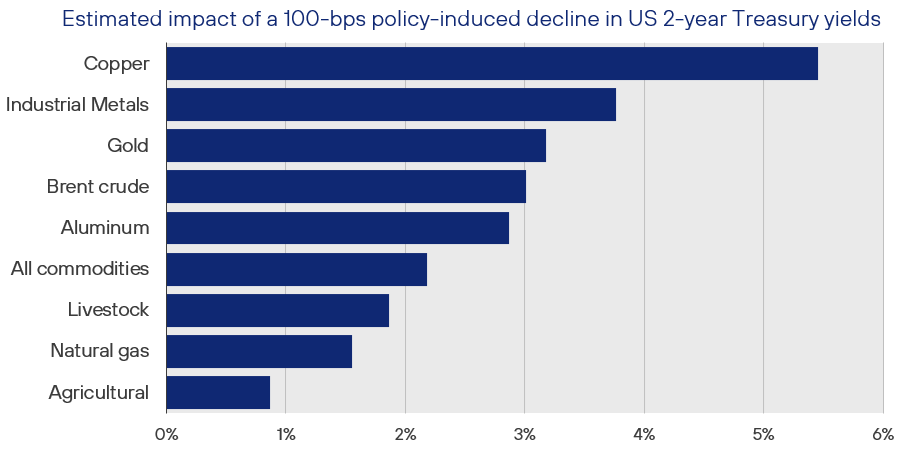
Source: Goldman Sachs Global Investment Research, as of February 29, 2024.
Economic Calendar
Key Economic Releases and Events for 2024 Q3
United Kingdom
Bank of England Official Bank Rate Release: 1st August, 19th September
GDP Figures: 14th August, 29th September
PMI Figures: 1st August, 2nd September
CPI Figures: 13th August, 17th September
Eurozone
ECB Monetary Policy Meeting: 12th September
GDP Figures: 14th August, 6th September
PMI Figures: 24th July, 22nd August, 23rd September
CPI Figures: 20th August, 18th September
United States
FOMC Rate Decision: 31st July, 18th September
GDP Figures: 25th July, 29th August, 26th September
PMI Figures: 5th August, 5th September
CPI Figures: 14th August, 11th September
Important Information
The information contained in this article is the opinion of Henderson Rowe and does not represent investment advice. The value of investment may go up and down and investors may not get back what they invested. Past performance is not an indicator of future performance.
This document is intended for the use and distribution to all client types. It is not intended for distribution to, or use by, any person or entity in any jurisdiction where such distribution would be unlawful and participation in the portfolio referred to herein shall not be offered or sold to any person where such sale would be unlawful. Any onward distribution of this factsheet is strictly prohibited.
The value of investments and the income from them can go up as well as down and you may realise less than the sum invested. Some investments may be subject to sudden and large falls in value and you may realise a large loss equal to the amount invested. Past performance is not an indicator of future performance. If you invest in currencies other than Sterling, the exchange rates may also have an adverse effect on the value of your investment independent of the performance of the company. International businesses can have complex currency exposure.
Nothing in this document constitutes investment, tax, legal or other advice by Henderson Rowe Limited. You should understand the risks associated with the investment strategy before making an investment decision to invest.
Henderson Rowe is a registered trading name of Henderson Rowe Limited, which is authorised and regulated by the Financial Conduct Authority under Firm Reference Number 401809. It is a company registered in England and Wales under company number 04379340.


