“If everybody is thinking alike, somebody isn’t thinking”
— General George S. Patton
The famous Stanford University neurobiologist, Professor Robert Sapolsky, observed that whilst the real world is a complex and continuously evolving process, humans often try to make sense of it by simplification. A basic example of this is ordering time into set periods, such as the Victorian era, or humans into discrete groups such as generational cohorts e.g., ‘Baby boomers’ and then attributing some common traits to them.
For even more complex issues reductionism is often applied: breaking things down into smaller component parts that are easier to comprehend, then recombining to try and understand the whole. As Sapolsky states, this is fine for understanding how a clock works but not life itself.
If this wasn’t difficult enough, the whole process is further complicated by randomness: many events are unpredictable, and even very small differences can be magnified depending on exact circumstances (no doubt you’ve heard of the “butterfly effect”). Sapolsky observes that humans will often look at past events and draw hard conclusions from them even though the outcome may have been largely due to specific random events. The mathematician and financial market theorist, Professor Nassim Nicholas Taleb calls this being ‘fooled by randomness’.
So, why have I started our financial commentary with scientific theory? Quite simply, predictions of financial markets show the strongest examples of arbitrary grouping, reductionism, fallacy of composition and being fooled by randomness. But, the honest answer to what happens next in any financial market is that nobody knows, including—as is becoming increasingly obvious—the major Central Banks themselves.
Yet even given these dubious foundations we have seen a remarkable consensus in financial market predictions for 2023.
The most predicted recession in history
Unusually, this year we have a high level of conviction around the US economy: we have the most predicted recession on record.
CHART
Based on US economists’ survey we have the most predicted recession ever
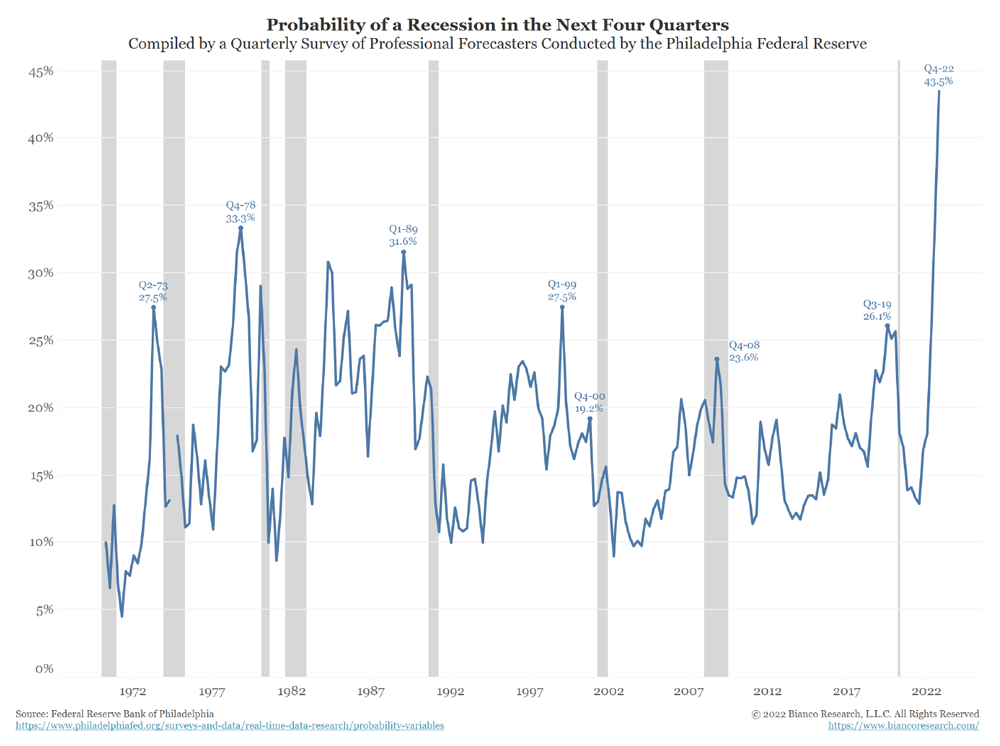
Source: Bianco Research
Despite this, many asset prices—such as equities—remain at historic premiums. This seems odd. Why is it that, in the face of a Fed-engineered economic slowdown and an apparently obvious recession, various asset prices remain so high? Part of the answer can be found in the ‘shape’ of US treasury yield curve.
“He was swimming in a sea of other people’s expectations. Men had drowned in seas like that.”
— Robert Jordan, New Spring
The US yield curve is effectively the collective opinion of treasury bond investors as to the expected future interest rates. This market is of outsized importance for a variety of reasons.
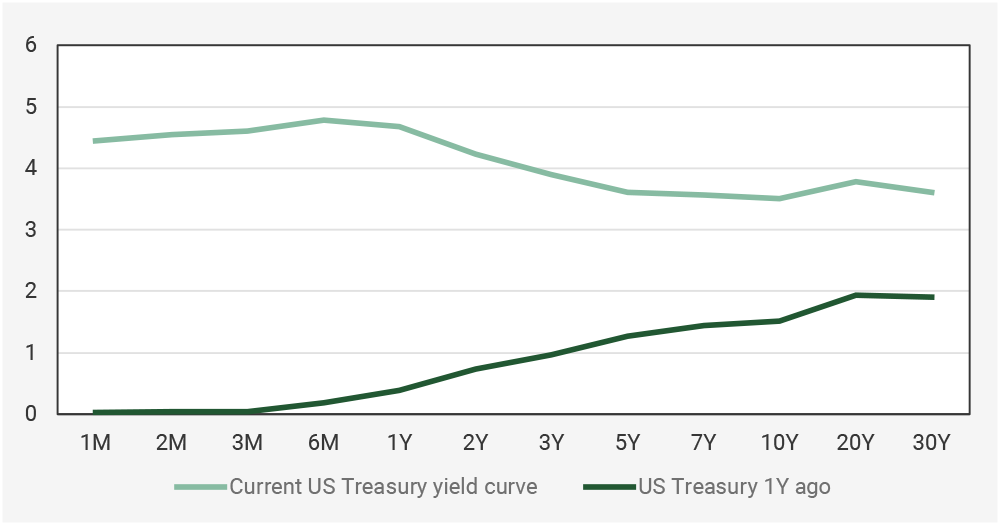
CHART
US yield curve is inverted, implying investors expect rates to be cut
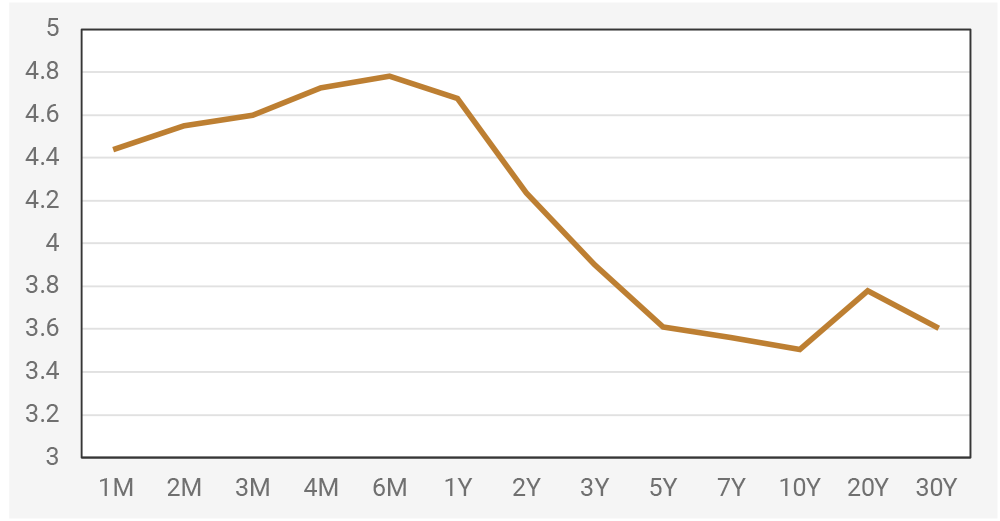
Source: Bloomberg
- It effectively sets the global interest rates due to the size of the US economy and the importance of the dollar as the world’s reserve currency.
- In terms of valuation, this is the discount rate used to evaluate various investments: as rates go higher, so does the effective return required to beat just leaving money in the bank on deposit.
- The market is also dominated by professional investors who are allegedly more sophisticated and less short-term focused than equity participants.
Finally, the shape of the US yield curve has an excellent track record in predicting future recessions. If professional investors are prepared to accept lower interest rates today that can only mean it is because they expect rates to be cut aggressively. Which is what you expect in a big recession.
What is even more remarkable about the current shape of the yield curve is how inverted it is, which simplistically means the bond market not only disagrees with the Federal Reserve but thinks a big slowdown in growth AND inflation is imminent.
CHART
Yield curve inversions and recessions
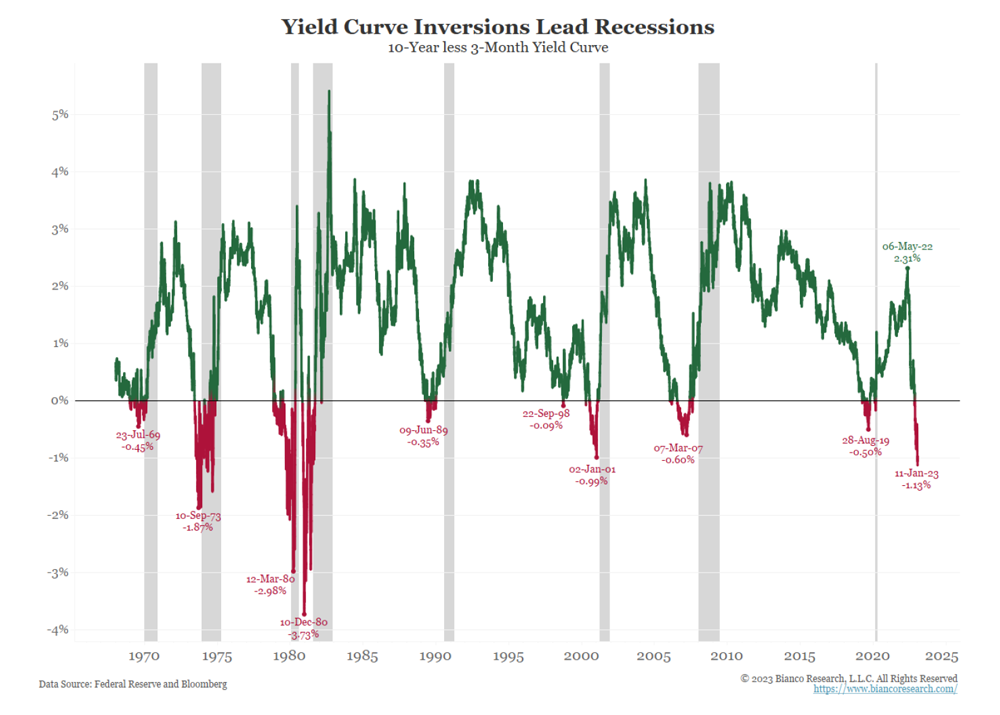
Source: Bianco Research
The bond market’s opinion is at odds with that of the Federal Reserve, which has indicated that it expects interest rates to remain above 5% for 2023.
Given this, what does the bond market see that the Fed doesn’t?
The first and most obvious difference could just be in the interpretation of data. One of the key reasons why the US economy could decelerate so quickly is that the official data is misleading. This is a remarkable claim but it’s not without some support.
The shutting down of large sections of the global economy is without precedent, yet this is exactly what happened during Covid. This had a massive impact on global supply chains, leading to a phenomenon known in international logistics management as the ‘bullwhip effect’.
“You’ve got to ask yourself one question. Do I feel lucky? Well, do ya, punk?!”
— Clint Eastwood, Dirty Harry
CHART
The Bullwhip Effect
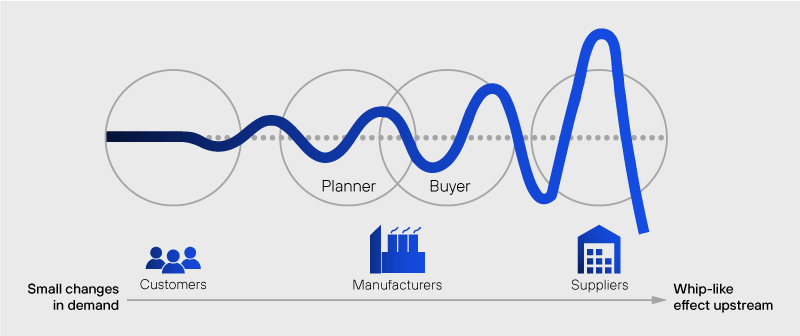
Source: Henderson Rowe
As you can see from this diagram, lead and lag times between consumers and manufacturers create stress in a supply chain which becomes more exaggerated along the various parts of the chain. In a way this is akin to the children’s game Telephone or Chinese Whispers, with the message becoming ever more distorted as it passes along the chain. By imposing such a massive shutdown and then restarting, the various parts of the global supply chain have been whiplashed like never before leading to massive exaggerations in demand and tightness in supply.
A simple, micro-example of this is currently being seen with stocks like Peloton. The lockdown hugely increased and enlarged the demand for their home exercise machines. Peloton took this as a sustainable level of demand and over produced their machines. However, Covid effectively brought forward and grossly exaggerated demand for their devices, leaving Peloton with huge inventory build up just as demand was falling away.
We expect the demand from a few sectors such as microchips and software were also grossly inflated by Covid or related factors such as crypto-mining which boomed with the monetary response.
CHART
Watch out for the cycle—Peloton shows the problems with miscalculating demand
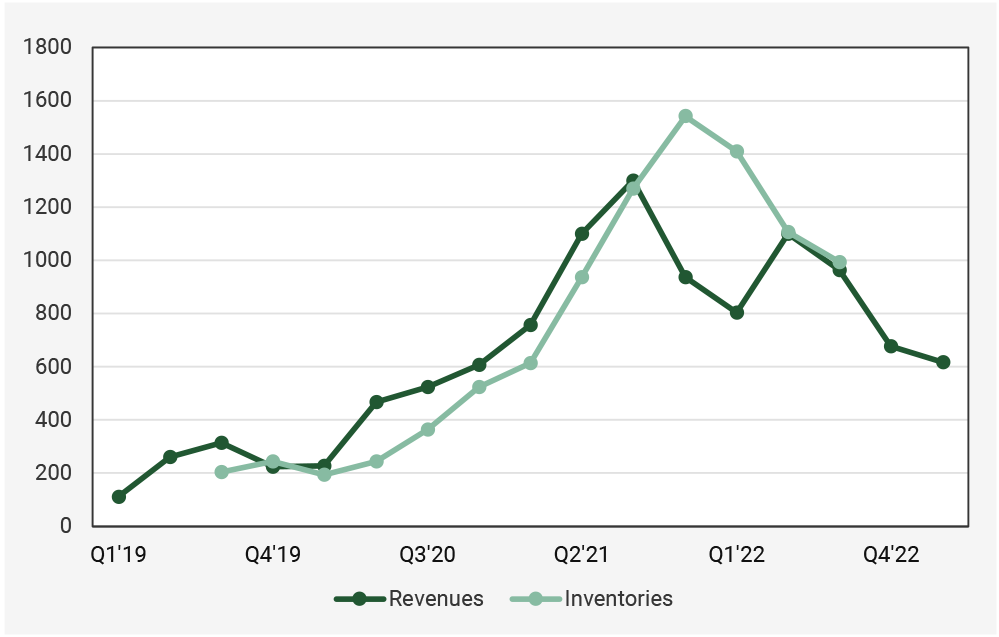
Source: Bloomberg & Reuters Infinitiv
A second example of this data interpretation anomaly is a difference of opinion of lead and lag times with monetary policy. The bond market expects the Fed’s monetary policy to take effect quicker than the Fed itself does. The Fed expects to hold its policy for the whole of 2023, whilst the bond market expects deterioration within 6 months. Whilst the yield curve has a good track of predicting recessions, it does not have a consistent record of how long these recessions take to occur.
CHART
Time lag as to recessions
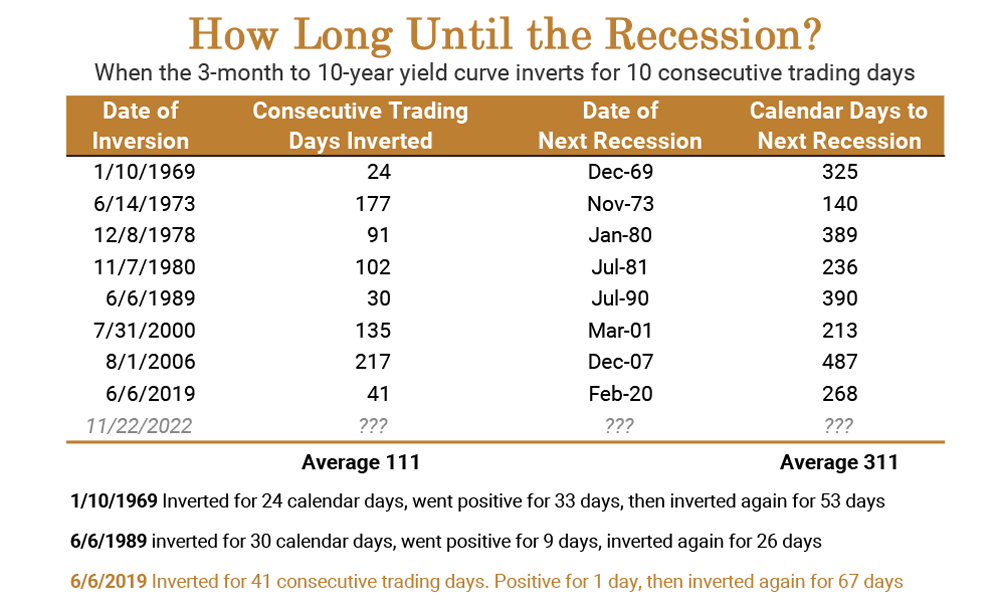
Source: Bianco Research
Outside of these macroeconomic reasons, we also have the possibility of some sort of financial crisis. In our last note, we highlighted some of these being of concern to professional investors.
Unsurprisingly, the events of the past 25 years—e.g. 2008 banking crisis or 1997-1998 & 2010-2012 sovereign debt crises—feature highly. The fact is that these events are not truly random—crises are an inevitable part of investing—but their actual timing and/or impact can be hard to predict. For example, the failure of the major US investment bank Drexel Burnham Lambert in 1990 did not cause the same level of problems as Lehman Brothers did in 2008.
The Bank of International Settlements does conduct research on likely candidates for systemic banking risks globally. Their work is based on key factors such as: Residential Property Prices, Foreign-Money Inflows, Domestic Lending Growth, Total Private-Sector & Household Debt Service levels. Based on these factors the top candidates in developed countries were: South Korea, Canada, Sweden, France, Japan, Switzerland, Hong Kong, New Zealand & Israel.
This also raises a tricky question about what sort of financial crisis would force the Federal reserve to act. For example, we are very sceptical that problems in the Hong Kong financial system would force a response from the Fed. But would another Eurocrisis? Ultimately, the Federal Reserve’s first responsibility is US domestic conditions and that means squashing inflation.
“I’ve lived through some terrible things in my life, some of which actually happened.”
— Mark Twain
Alternatively, the bond market could simply be wrong!
The huge monetary experiments of the past 10-15 years have grossly distorted the normal operation of the market. The current crop of investors have very little experience of inflation and the crises of 2008 to 2020 feature heavily in their thinking.
CHART
The bond market was wrong last year, too
Source: Bloomberg
“It was necessary to destroy the village in order to save it.”
—the strange case of equity market valuations.
Yet if we assume the bond market’s gloomy view is correct then the valuation of many other assets classes—such as US equities or credit—become even harder to fathom.
The Fed has repeatedly stated that it wants to cool the economy and tighten financial conditions, which has historically not been good for equities. The bond market is even more pessimistic and thinks—one way or another—that the Federal Reserve is getting it badly wrong. If either the US economy is much weaker than the data suggests, or if there is an imminent crisis, then it’s hard to see either of these being positive for equities, especially if the Fed has failed to extinguish inflation at that point.
CHART
Equity valuations still seem high by historic standards
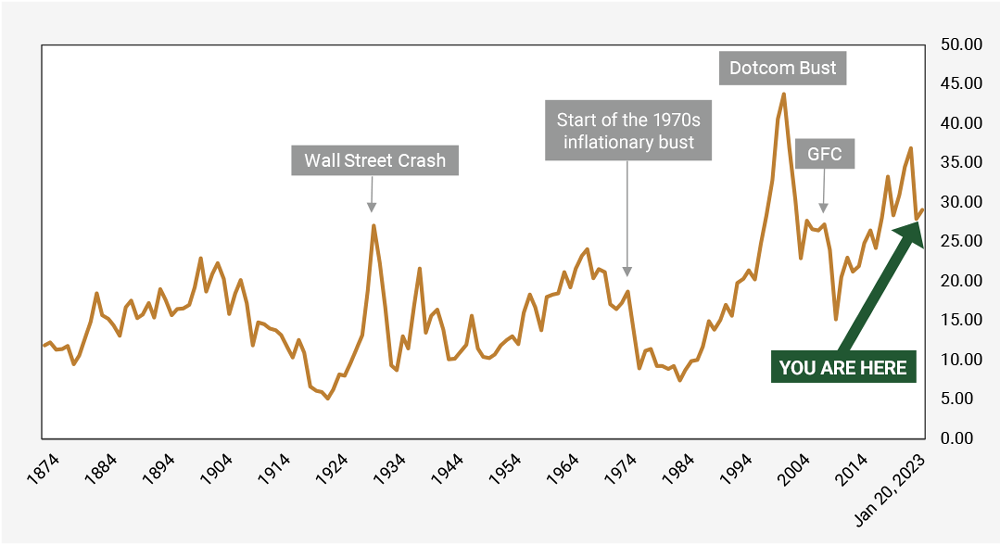
Source: Shiller CAPE/Bloomberg
This leaves two main conclusions on equity valuations:
- Either the equity market believes the Federal Reserve manages a smooth landing, and the bond market is far too gloomy.
- Or the stock market has drawn some very optimistic conclusions from the previous episodes of crisis and appears to assume any crisis would be short lived, with fresh rate cuts and possibly even more money printing likely.
Equity investors appear to have become addicted to excess liquidity with an attitude of ‘the worse it gets, the better it is’.
“Time makes fools of us all. Our only comfort is that greater shall come after us.”
— Eric Bell
In summary, either the bond or equity market has made a mistake. Indeed, it’s quite possible that they are both wrong!
To disrupt this consensus, the economy just needs to gradually slow down with the much-predicted recession taking longer to ferment than expected or even not at all. This could be because financial tightening takes longer to impact the economy. As the Federal Reserve itself has repeatedly stated, monetary policy acts with long and variable lags. Higher bond yields will likely put pressure on equities due to higher discount rates. Meanwhile there remains a range of risks, such as a second wave of inflation or an energy spike caused by reopening of China that would force the Federal Reserve to stick to its guns.
There is also the tricky question for bond investors: how and at what price will the vast amount of new government debt be financed? Without a rush to safety, will the coming wave of government debt cause the market to reprice due to basic supply and demand? What does that mean for corporate funding costs and therefore equities?
So, what is an investor to do?
Have a sensibly constructed portfolio. Last year, many investors were surprised by the amount of duration risk in their supposedly diversified portfolios. Others were over-diversified and discovered new and innovative ways to lose money in their portfolios. As we repeatedly have said, complexity is the nemesis of good risk management.
View things probabilistically. At Henderson Rowe-Rayliant, our approach is that we view the world as a vast, dynamic complex system. We view some events as more likely, others less so but—that doesn’t mean they cannot happen. To counteract this, we embed probability into our portfolio construction by including some assets that we think offer a higher level of expected return in certain states of the world even though that might disagree with our core view.
Accept that we’re still in the middle of events unfolding. Our core view remains defensive. We have not yet seen the full impact of the Federal Reserve’s tightening yet, nor has the Federal Reserve itself. So we suspect the Fed will pause soon to see how things develop. This is not the same thing as a change in the Fed’s overall policy. We suspect inflation may well have peaked but that doesn’t mean it’s about to collapse. We see it spreading into services and wages, and absent of an almighty crash it’s difficult to see these disappearing with a few months. Inflation is a process.
Breathe. Unfortunately, due to random events, we must accept that portfolios can underperform for periods of time due to pure chance. Also bigger regime shifts and ‘Daddy’ bear markets can take several quarters to unfold. As we have pointed out before there are likely to be several sharp rallies during this time. Avoiding the sirens’ song to change strategy during these periods of underperformance—as the investing tides change—can be hard. Therefore, something else investors need to have is patience—something most humans tend to be very bad at and this is especially true if things are going badly.
Be prepared. There is a high chance events will unfold very much against consensus. Merrill Lynch’s long time former head of research, Bob Farrell, phrased it as “When all the experts and forecasts agree—something else is going to happen”. It is highly likely that some investors are going to be unpleasantly surprised in 2023. Should this occur, Professor Sapolsky observed, “it takes surprisingly little in terms of uncontrollable unpleasantness to make humans give up and become helpless in a generalized way.” This wider investor apathy is often a great entry point for long term deployment of capital. We expect to take advantage of this over the course of 2023.
Important Information
The information contained in this article is the opinion of Henderson Rowe and does not represent investment advice. The value of investment may go up and down and investors may not get back what they invested. Past performance is not an indicator of future performance.
This document is intended for the use and distribution to all client types. It is not intended for distribution to, or use by, any person or entity in any jurisdiction where such distribution would be unlawful and participation in the portfolio referred to herein shall not be offered or sold to any person where such sale would be unlawful. Any onward distribution of this factsheet is strictly prohibited.
The value of investments and the income from them can go up as well as down and you may realise less than the sum invested. Some investments may be subject to sudden and large falls in value and you may realise a large loss equal to the amount invested. Past performance is not an indicator of future performance. If you invest in currencies other than Sterling, the exchange rates may also have an adverse effect on the value of your investment independent of the performance of the company. International businesses can have complex currency exposure.
Nothing in this document constitutes investment, tax, legal or other advice by Henderson Rowe Limited. You should understand the risks associated with the investment strategy before making an investment decision to invest.
Investors should be aware of the risks associated with data sources and quantitative processes used in our investment management process. Errors may exist in data acquired from third-party vendors, the construction of model portfolios, and in coding related to the index and portfolio construction process. Information contained in this fact sheet is based on analysis of data and information obtained from third parties. Henderson Rowe Limited has not independently verified the third-party information. The firm, its directors, employees, or any of its associates, may either have, or have had, a position, holding or material interest in the investments concerned or a related investment.
Henderson Rowe is a registered trading name of Henderson Rowe Limited, which is authorised and regulated by the Financial Conduct Authority under Firm Reference Number 401809. It is a company registered in England and Wales under company number 04379340.