Market Commentary

Quarterly Commentary

Autumn 2019

Market Overview

While currency, equity and bond markets yo-yo at the mercy of Trade War headlines it is worth recalling the story that in the 1420s China sent a massive fleet all the way to Europe helping to trigger the Renaissance. It did not end well. All evidence of the voyage was destroyed by envious Beijing bureaucrats. Today, adventurous Chinese businesses are fully supported by their state but now it is their strategic rival, the USA, that wishes them ill. The Trade War has deeper roots than trade, and as China’s military and economic prowess increase, so do US strategists’ concerns at their shrinking lead in technologies and resources. Attempts by Mr. Trump to partially or completely excise China from the US dominated financial system add an extra frisson to nervous global markets.

With China’s equity markets the same size as Europe’s, it is a little late for Mr. Trump to stuff this genie back in its bottle unless he wants a real fight. Meanwhile WTO data show trade is already suffering and based on PMI (Purchasing Managers’ Index) numbers, the US does not look to be winning the conflict. China’s latest Caixin Manufacturing PMI surprised positively at 51.4, with new orders up at their fastest pace since March 2018, despite declining exports. China has proved itself adept at pulling the right macro levers. Compare this with the US’ trade war ‘own goal’ PMI, an abysmal 47.8 and, underlining an even greater dependence on trade, Germany’s reading of 41.7.

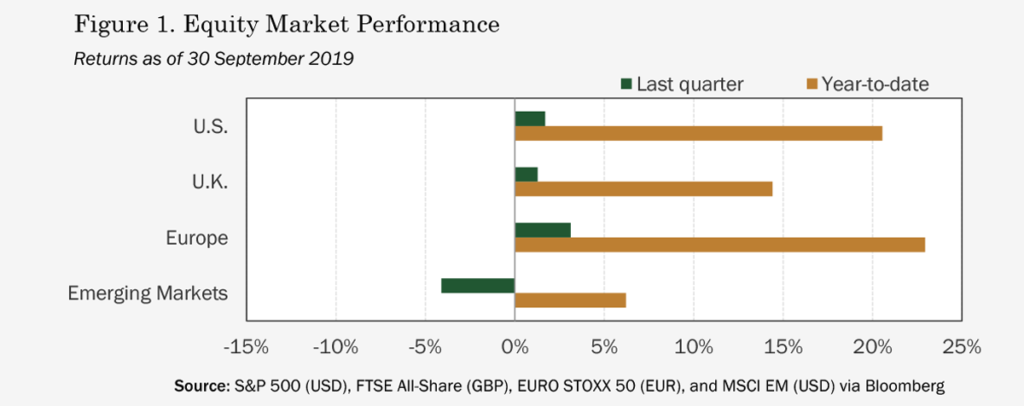
The Brexit drama too is laden with historic baggage and threatens more disruption to trade systems. It joins the Middle East, Hong Kong and Argentina as crisis catalysts. With a background against which several apocalyptic scenarios can be painted, equity markets, especially those in the US, have trickled along at current levels for the last two years. Strong US employment figures and unusually low wage and inflation pressure give the Fed breathing room for a couple of 25 basis point rate cuts before December to shore up confidence. But extended low rates are part of the problem, and Draghi’s final shots from the ECB have encountered strong resistance from member states, exhausted by years of intervention and weak growth. The IMF’s latest deeply gloomy report points to how low rates force investors and companies to seek high-risk returns. It also argues trade wars will cost US$700 billion per year as confidence plummets and that US$19 trillion of corporate debt is at risk of default.

The S&P 500 Index’s forward P/E is 19x, against a range of 35x–10x since 2000. The bottom of that range marked 2009. Could markets descend to such levels again in the near future, extra painful if underlying earnings fall in a recession? It is possible to argue investors are overly nervous, anchoring on memories of the Global Financial Crisis. But debt concerns are visible in several directions. Recent government bond auctions in the US, Germany and Japan have struggled. As the annual US Federal deficit hits US$984 billion in 2019, equivalent to 4% of GDP, the consumer also looks exposed. Automotive manufacturers and lenders from Capital One to Ping An have been loading buyers with unaffordable debt. A third of US buyers roll debt from old cars into new ones as the average loan stretches to 69 months, a record.

Such data make investors nervous. But the rationale for holding equities is long run growth and this still applies, though the productivity engine runs quietly and is hard to detect in short-term returns. For example, our well-heeled friends in Extinction Rebellion inadvertently remind us of ample investment opportunities via green environment and energy projects: the Bill Gates backed Global Commission on Adaptation’s conveniently timed report, ‘Adapt Now’, highlights five areas where US$1.8 trillion invested could generate US$7.1 trillion net benefits between 2020 and 2030, with plenty more where that came from. While these returns are not purely financial, the scale of the emerging green investment universe is massive. Similarly, disruptive demographic changes like ageing populations and mass migration conceal huge shifts that have been driving growth for many years. China alone is seeing so much value in its rapidly growing urban middle class that its tech giants are focusing almost entirely on their domestic market. Expansive development is taking place elsewhere in Asia as well.

Many other forces are quietly humming under the hood, steadily delivering efficiencies and new capabilities. Developments in quantum computing, for instance, promise massive increases in computational power at a fraction of current energy consumption. And the National Academy of Sciences reckons a mere US$200 million per year investment could lead to commercially viable fusion reactors – the ultimate clean energy – before 2050. There are many such stories, hard to quantify but cumulatively powerful. It is reasonable to look at the shape of the financial system with concern, but investors (and climate change activists) can take comfort from long-run changes in population and technology that promise more wealth creation and environmental benefits to come, lifting millions more into prosperity. The long-term equity bet remains intact.

Asset Classes

Equities

The third quarter brought two Fed rate cuts, easing by an additional 15 central banks around the world, and another move up for developed market equities—albeit at a slower pace than what we saw in the first half. For the three months ending in September, US stocks added 1.7%, UK stocks rose by 1.3%, and European equities were up 3.1%; EM shares didn’t fare quite as well, shedding –4.11% for the quarter (see Figure 1). Most of the latter’s losses can be attributed to Trump’s early-August tweetstorm promising 10% more in tariffs on US$300 billion of Chinese goods, a retaliatory 2% slide in the RMB which led the US to officially label the folks at PBOC “currency manipulators”, and an order from China’s government to its SOEs demanding they stop buying agricultural products from US farmers.

Of course, it hasn’t just been the Sino-US trade war giving investors jitters in 2019. Risks hanging over global markets include everything from a potential no-deal Brexit to heightened tensions in the Middle East, from a polarizing impeachment inquiry in the US to escalating violence on the streets of Hong Kong. For those of us who read the news each morning in despair, concluding things must be getting worse by the hour, practitioners of the dismal science are happy to offer up some empirical support. An index created by economists to measure global economic policy uncertainty based on textual analysis of thousands of newspaper articles shows policy risk marching steadily upward over the last decade and reaching record highs in the third quarter of this year (see Figure 2).

Unfortunately, when policy makers falter, so does the macroeconomy. It stands to reason a trade war between the world’s two largest economies is bound to eventually take a toll on global growth. Although warning signs have been flashing around the world throughout 2019, a particularly troubling red flag went up in May, when the yields on 10-year and 3-month US Treasuries inverted. Since 1950, such an occurrence has preceded each of the last seven US recessions. The Fed’s own model currently pegs the probability of a recession within the next year at close to 35%, the shortest odds given to a serious downturn since just before the Global Financial Crisis (see Figure 3).

Looking past all the uncertainty and dire forecasts, it’s worth noting that when markets bake so much pessimism into prices, it invariably creates pockets of value for investors with diversified holdings and a long-term focus. The MSCI EM Index, beaten down by escalating trade tensions, ended September with a forward P/E of 11.9 vs. 15.8 for developed markets in the MSCI World Index, while MSCI UK stocks, reeling from months of angst over Brexit, traded at a forward P/E of just 12.3.

Fixed Income

Accommodative monetary policy coupled with a push by anxious investors into less risky assets drove yields lower and bond prices higher in the third quarter, with bonds generally outperforming stocks over the last three months (see Figure 4). UK gilts and corporate bonds had a particularly strong run—returning 6.2% and 3.9%, respectively—as developments in the Brexit drama during Q3 made a rate cut by the Bank of England seem much more likely, whether or not October brings a deal with Brussels.

If UK central bankers did cut rates, they would find themselves in good company. Of the 38 policy rates tracked by the Bank of International Settlements, 22 were lower at the end of September than when they started the year (see Figure 5). Indeed, a look at the data reveals there’s been much more easing than tightening over the last decade. A remarkable effect of that trend—and a serious concern for fixed income investors—has been a surge in the amount of negative-yielding debt in global bond markets, with the market value of such assets climbing from US$8 trillion at the beginning of 2019 to US$15 trillion as of the end of September, or about 26% of all debt tracked by the Bloomberg Barclays Global Aggregate Bond Index (see Figure 6).

Alternatives

After posting essentially flat performance in Q2, the tailwind of falling interest rates helped push REITs to new highs through the end of September, with developed world property up 4.5% for the quarter, bringing REITs’ year-to-date return to just under 20% (see Figure 7). According to industry group Nareit, of all property types tracked, only regional shopping malls showed negative returns in 2019, losing –4.6%, while data center properties posted the best performance, up 48.5% through the end of September (online shoppers might feel some responsibility for the disparity). Heading into Q4, REIT fundamentals remain solid and, despite this year’s gains, valuations don’t seem too stretched. Nareit data show the average price-to-funds-from-operations (P/FFO) ratio for US REITs—the equivalent of a P/E ratio for real estate investments—has been trading in the range of 15–18x, firmly in line with REITs’ historical average of roughly 17x since 2009.

Turning to commodities, oil saw some action in the third quarter—quite literally—as a pack of aerial drones hit state-owned refineries in Saudi Arabia in mid-September, knocking out roughly half of the nation’s capacity, amounting to just about 5% of global production. Unsurprisingly, the shock to supply jolted oil prices, which popped nearly 16% in the aftermath of the attacks (see Figure 8). But the move was temporary, and by month’s end slowing growth and the economic uncertainties discussed before saw prices fall to pre-strike levels, leaving oil lower by –6.4% for the quarter.

Looking Ahead

The gyrating equity markets have been rangebound rather than extreme over the last few months, despite the bipolar realpolitik. As earnings season continues, we shall see if such uncharacteristically measured behaviour is justified. So far, with just over 10% of results out of the way, the general theme has been sales weakness but positive earnings surprises. One thing that is not a surprise is that nearly every management team’s outlook crystal ball is cloudier than usual thanks to Brexit and Trade Wars.

Closing Comments

Our Quantamental approach to investing, which blends the best human analysis with leading edge quantitative tools, is a bit like guiding a big tanker ship through the Panama or Suez Canal: computers and humans working together to secure safe passage for a valuable cargo. While the machine is crunching the numbers, making a large number of small adjustments in milliseconds, experienced people are on the lookout for something out of the ordinary, applying human insight to double-check the computer’s assumptions. But here’s the hard part: From time to time, when a storm hits, human supervision becomes invaluable, although that’s also precisely the moment human behavioural bias can do the most damage.

It’s during events such as Brexit or a trade war between the US and China when we need to rein in our natural bias—to avoid overtrading, for example, or to prevent fear or greed from clouding our judgement—but we must also be on the lookout for “fat tail” events at the extremes of our past experience for which the machine might not be prepared. This is exactly how the Quantitative and Fundamental teams at Henderson Rowe and Rayliant work together. Knowing our weaknesses as humans and the limitations of our computer’s models, as well as their relative strengths, allows us to steer our clients’ portfolios through these turbulent times.

IMPORTANT INFORMATION

This publication does not constitute a financial promotion as defined by Section 21 of the Financial Services and Markets Act 2000 (FSMA).

This document is intended for the use and distribution to all client types. It is not intended for distribution to, or use by, any person or entity in any jurisdiction where such distribution would be unlawful and participation in the portfolio referred to herein shall not be offered or sold to any person where such sale would be unlawful. Any onward distribution of this factsheet is strictly prohibited. The value of investments and the income from them can go up as well as down and you may realise less than the sum invested. Some investments may be subject to sudden and large falls in value and you may realise a large loss equal to the amount invested. Past performance is not an indicator of future performance. If you invest in currencies other than Sterling, the exchange rates may also have an adverse effect on the value of your investment independent of the performance of the company. International businesses can have complex currency exposure. Nothing in this document constitutes investment, tax, legal or other advice by Henderson Rowe Limited. You should understand the risks associated with the investment strategy before making an investment decision to invest.

Investors should be aware of the risks associated with data sources and quantitative processes used in our investment management process. Errors may exist in data acquired from third-party vendors, the construction of model portfolios, and in coding related to the index and portfolio construction process. Information contained in this fact sheet is based on analysis of data and information obtained from third parties. Henderson Rowe Limited has not independently verified the third-party information. The firm, its directors, employees, or any of its associates, may either have, or have had, a position, holding or material interest in the investments concerned or a related investment.