“Strategy is easy, but tactics—the day-to-day and month-to-month decisions required to manage a business—are hard”
—Arthur Rock
Summary
-
-
- 2024 should start to see the impact of rate rises, and we think public finances will start to play more of a role in markets
- Across the West, it’s beginning to look as though any election victories may be pyrrhic as deep-seated socioeconomic problems start to emerge
- We think bonds are back to looking expensive, but we see growing value in international equities
-
What happens when the immovable object meets an unstoppable force? Strictly speaking, this is a nonsense statement as they are mutually incompatible: one is either an irresistible force or it is an immovable object. In the natural world, neither of these forces can exist as the former would require infinite energy and the latter infinite mass—in other words a black hole.
However, setting up a thought experiment between the various irresistible forces and immovable objects in the global economy still has some value in constructing a portfolio.
The Big Macro Drivers
In terms of irresistible forces, we have rate hikes. These will slow the economy but unfortunately interest rate policy famously acts with long and variable lags, so timing their impact is hard.
As we explained last year, a useful guide is the yield curve which is the price of money through time. When it inverts, it means the market has priced interest rates lower in the future than today which often heralds a recession. Based on previous yield curve inversions, the effect could be seen anywhere from Q2’23 (when several banks failed) through to Q2’24 this year.
The UK and US Yield Curve Are Pricing Cuts (23/1/24)
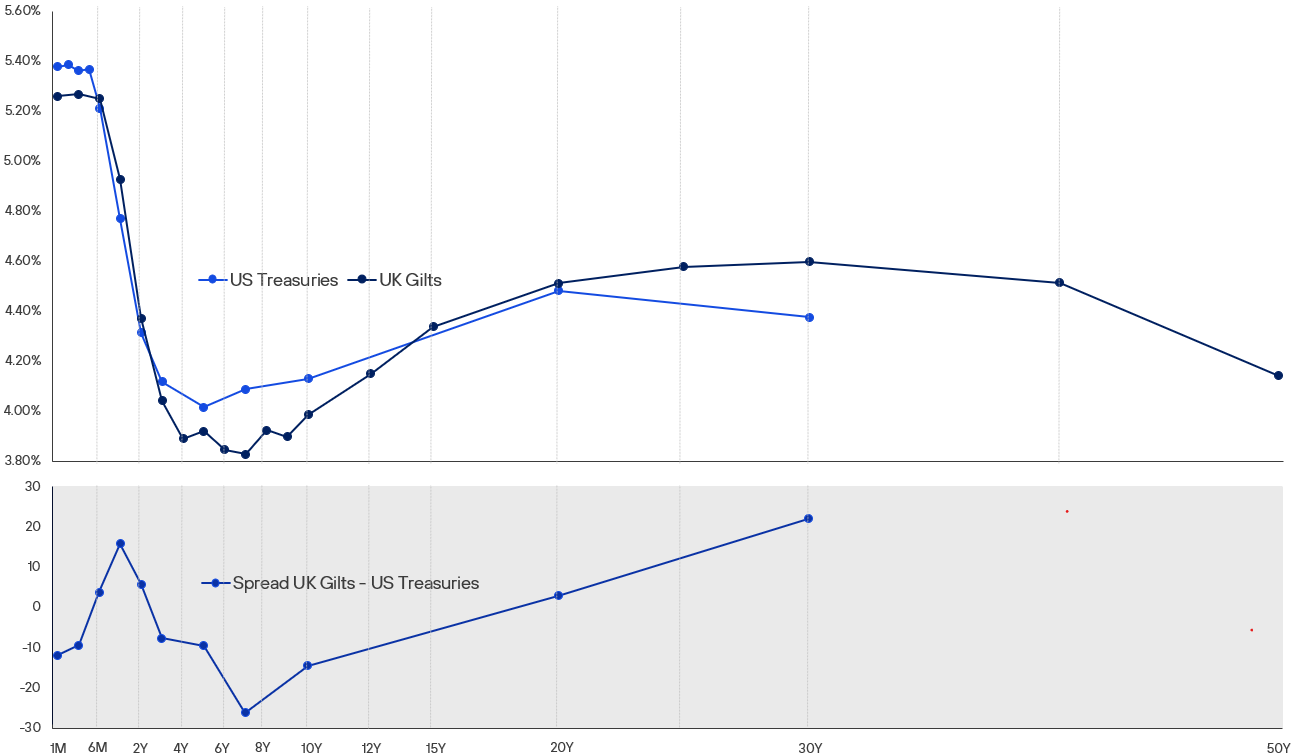
Source: FactSet & Henderson Rowe
But it’s important to remember that an inversion has been a strong guide, not an iron law of physics; neither is the timing reliable, especially after such a massive wave of financial stimulus that accompanied the Covid pandemic. So, at best, it is a weathervane.
Last year we thought the bond market had become too pessimistic, too soon. Now the issue is more finely judged, as we should expect to see the impact of higher rates on the real economy this year. This is likely to be seen sooner in the UK than the US due to its higher sensitivity—as an economy—to short term interest rates: as we saw last week from the retail sales data, there is strong evidence the consumer has begun to struggle.
In addition to this, we are beginning to see large and growing losses beginning to surface in many sectors such as commercial property, private equity and bank portfolios. The net effect of this is that banks tend to reduce lending which starts to reduce the amount of money and credit in circulation. This further slows economic activity.
Whilst the process of deglobalisation may have started, it is likely to be extremely protracted unless there is a very sharp breakdown in China’s relations with the West. The West has neither the capital nor the skills to onshore this business, whilst China’s own economic issues and slowdown are causing goods deflation as its currency weakens and it tries to export its way out of problems.
All these factors tend to be disinflationary (i.e. slowing the rate of inflation) if not deflationary, especially if losses in the financial sector get worse. They are powerful forces that push for falling inflation and a slowing economy. For the bond market this has once again become the consensus and triggered a last-minute rally in bonds.
But…
The natural tendency for economies is to grow over time, especially when we consider government spending being the other force acting on the economy. Depending on how it is spent, this can be highly stimulative for the economy: for example, big infrastructure projects can have large, positive long-term benefits. But a critical issue is how this money is spent and, unfortunately, governments generally have a poor record of doing this especially compared to private industry. In essence, governments often get less than £1 of return for every pound invested.
A potentially immovable object on the horizon is the limit to how much governments can borrow. The problem here is that we don’t know what this limit is, as it can vary considerably. In their study of government borrowing “This Time it is Different,” the academics Reinhart and Rogoff came up with a rule of thumb of approximately 90% debt/GDP.
Many Countries Have Surpassed 90% Debt/GDP
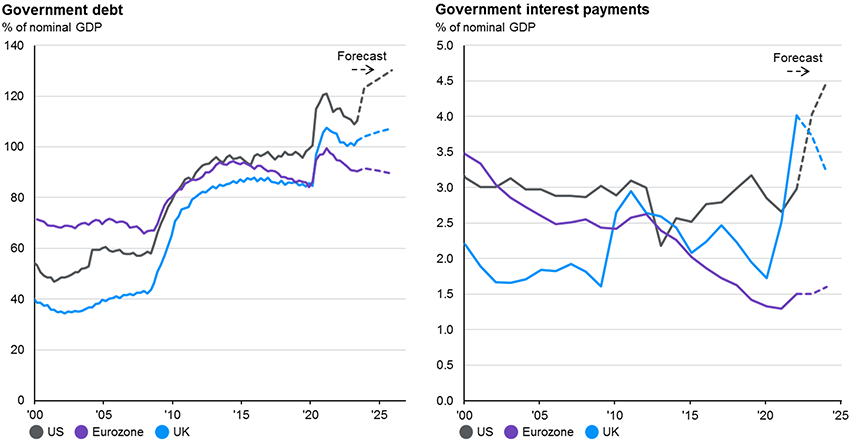
Source: JPMorgan
But again, this is only a guide. Some countries have exceeded this and recovered, whilst others have failed at far lower levels of debt. Additionally, as governments start to approach these debt levels, their demand for funding usually causes rates to rise. This starts to squeeze the private sector out of the market, thereby slowing the economy and exacerbating the problems.
A further problem for many developed countries is an aging population and therefore growing healthcare costs and falling productivity. A series of countries have tried to address this through increasingly contentious approaches to immigration. Whilst importing people technically increases the size of the economy it overlooks several key issues. As the famous Nobel prize winning economist Milton Friedman long ago commented, “a country can have open borders, or it can have a welfare state. It cannot have both.”
Whilst many jobs in the developed economies do not require a highly skilled workforce (is a bus driver in London any more skilled than one in Johannesburg?) the actual relative wealth of advanced nations relies on a very small number of highly productive citizens and industries. Typically, these citizens have advanced skills that are difficult to replicate and, usually, less developed countries have neither the education nor companies needed to produce these workers to the standard that an advanced economy requires: the developed world generally needs highly skilled workers, so the immigrants they really need are mainly to be found in other advanced nations who also need them. At which point, it comes down to remuneration.
By contrast, countries like the UK appear to have been importing lots of lower value-added immigrants and—in line with Friedman’s comment—don’t appear to have properly costed the additional claims they will make on resources. Recently, the Dutch did and discovered that it had made their problems worse. We suspect they will not be the only country to do so, and we may yet find the recent burst of immigration in the West lead to an acceleration of problems.
Many Countries GDP Per Capita Has Stalled
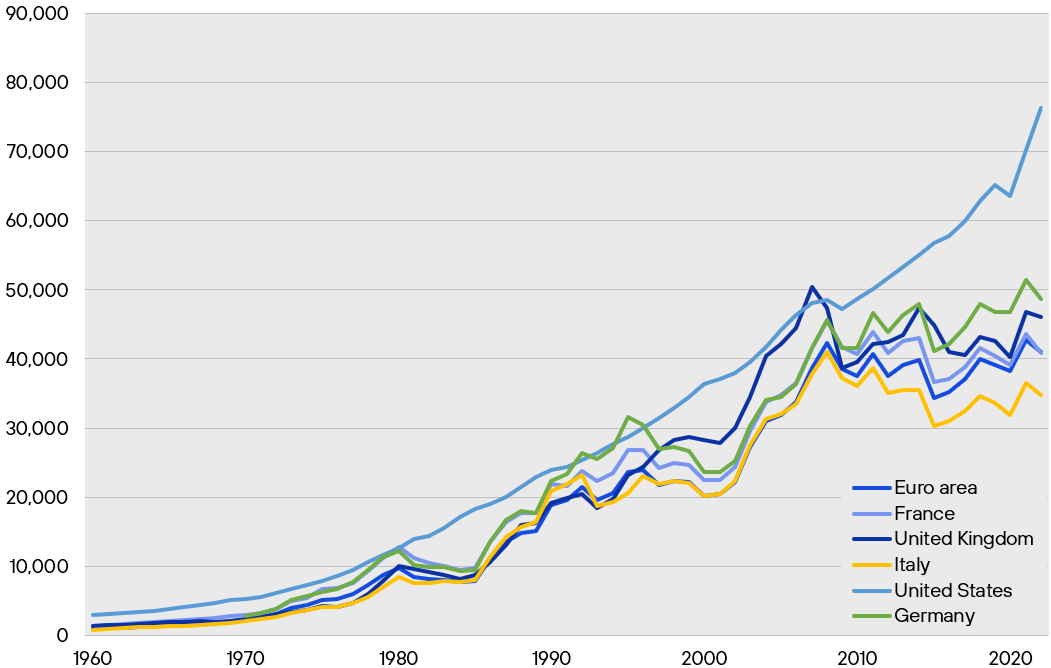
Source: World Bank and Henderson Rowe
Given the growing complications with immigration, an alternative “solution” for stressed governments is to monetise the debt through the printing press. This is not without its issues. It is—at best—a short term fix and does nothing to address actual productivity or growth issues in the economy. Using the printing press to create money to pay bills tends to devalue the currency and will often fuel inflation. Countries that tend to repeatedly use this option often lose the ability to borrow in the own currency as investors decide to go elsewhere.
Combined with other deep-seated economic issues—such as increased bureaucracy and under-investment in key factors such as education, capital stock, or cheap energy—we think the next few years are likely to be difficult as reality catches up with debt-laden economies. Ultimately, we suspect the temptation of money printing is likely to prove difficult to resist. The “revealed preference” of many governments over the last few years is that they will try to raise funds through the printing press. This will likely add to inflationary pressures over time. So, our base case is that we see a period of stagflation and growing social tensions.
The US Bond Market Dominates All Others
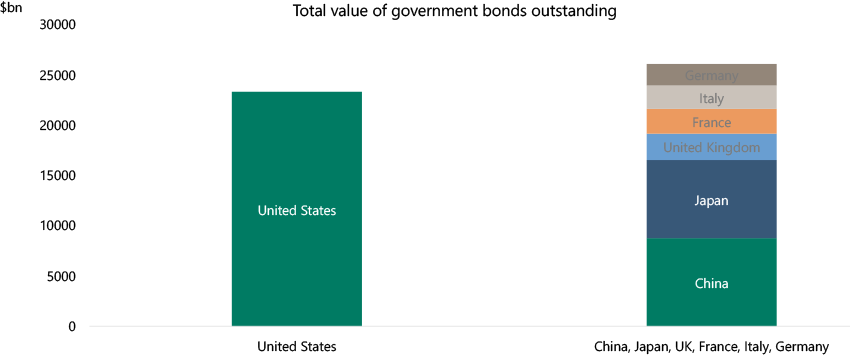
Source: Apollo Global Management
A key issue is therefore investor confidence in 2024. As we saw under the brief Truss premiership, if the market starts to doubt the ability to get paid back then problems can escalate quickly. Will this be a key issue this year? We are not sure, but given its status as the world’s biggest borrower, then the US election and their market are key.
Events, Dear Boy, Events
This brings us to the thorny issues of randomness and chance, or what Donald Rumsfeld called known unknowns and unknown unknowns. The difference is that the first are events we know will happen but don’t know the outcome, the latter are events that are completely random or unexpected.
On the known unknown front, we have elections. 2024 is in fact the biggest ever election year in human history. Four billion people in 76 countries will go to the polls this year, a large percentage of which will be free and fair.
The most obvious are the UK and US elections, but we also have 27 different elections in the EU. With many politicians of all colours making impossible promises based on government spending, we suspect that as elections loom the market will increase its scrutiny. So whilst they are known events, the impact they have will be unknown.
The unknown unknown front is—by definition—harder to prepare for: as we have seen over the past few years, this has included pandemics, terrorism, wars, and natural disasters.
Valuations
So far, as we can see, we have a tremendous meeting of forces. But a key final component is: do you get paid for this uncertainty? And the short answer is: in many markets, no.
As we have repeatedly pointed out, the US equity market especially has priced many things optimistically. This is partly a function of excess liquidity and anchoring to the strategies that worked best over the past few years. At some point it seems highly probable that there will be some reversion to the mean. Whilst valuations matter little year to year, over time probability will ultimately catch up.
Whilst Valuations Matter Little Year-to-Year, Over Time It Makes a Difference
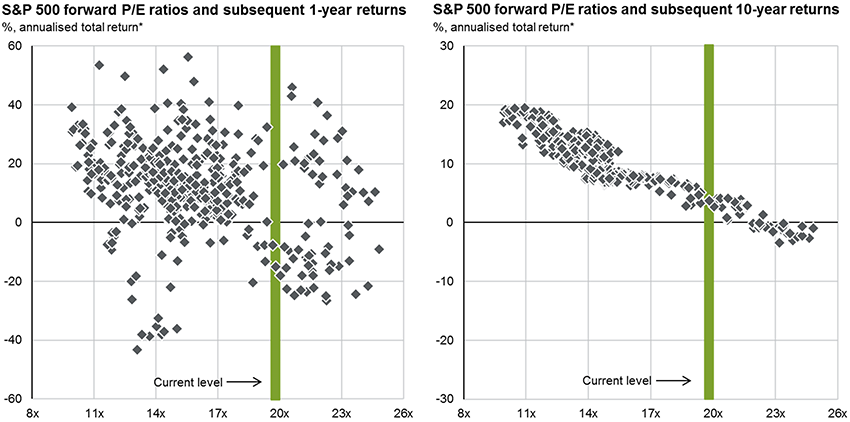
Source: JPMorgan
But calling the top in markets is largely a fool’s errand, and instead what is more useful is trying to avoid the more obvious low-probability payoffs such as overpaying for investments.
By contrast, as we discuss in the equity section, other markets are beginning to look cheap
The US Looks Expensive, Other Markets Are Starting to Look Cheap
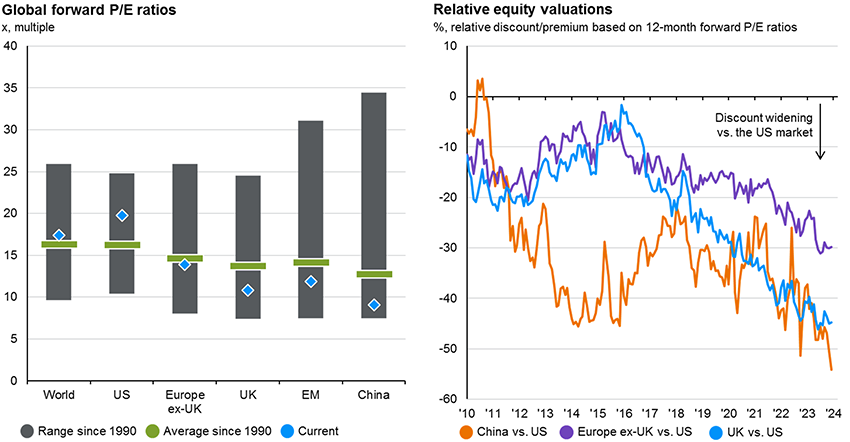
Source: JPMorgan
Putting It All Together
Our core view remains that we believe the market is going through a bigger regime shift. As we have discussed, we think government spending looks unsustainable and we suspect there will be a higher level of inflation over the next few years. That said, we expect inflation to be volatile as we go through this bigger shift.
Given their recent rally, we believe bonds are generally back to looking expensive especially given the very high levels of predicted supply. In our opinion, this can only be justified if the UK and US are going into a significant recession. This is possible but we suspect the government would up stimulus spending further. Given the unsustainable levels of spending even before we have a recession, we are very much concerned at what levels of deficit would occur in a downturn. So, we suspect the gains in bonds may well be fleeting before investor confidence starts to erode.
The Market Expects the Bank of England to Start Aggressively Cutting Rates
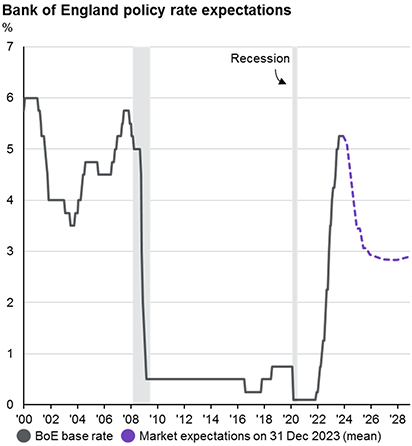
Source: JPMorgan
Hence, we think the true irresistible force is the massive unfunded social commitments of an aging population against the growing immovable force that is public finances: something that is beginning to look like a black hole. Forget the promise of Artificial Intelligence, these are very much going to be the “mega trends” that will increasingly dominate the sociopolitical landscape over the next few years.
However, as the quote at the beginning of this Outlook highlights, timing when and how these big changes impact investments is extremely hard.
Given share prices remain expensive by historical levels in key markets like the US, we continue to favour a core portfolio of defensive, international equities. To this we have started adding some smaller companies with good growth opportunities, selected emerging markets to provide an uplift, and finally a high cash balance to take advantage of opportunities. In essence we are accepting greater volatility in expectation of better return.
What we are debating is whether the current US Administration’s determination to get re-elected at the cost of the national balance sheet may trigger one last burst in the stock market. We do wonder whether we might be seeing a re-run of the 1998-2000 period. The Federal Reserve and other Central Banks injected liquidity into the market due to the Asian and Russian crises, which caused a final huge rally in speculative assets before the 2000 crash. If this is the case, we may well underperform for a short period.
I appreciate the tone of this note may seem negative, but it is just life and has always been so. A well-known behavioural trait is that humans tend to view the “certainty” of the past as a better time when compared to the challenges and uncertainty of the future. The reality is the periodic resets and major regime shifts are a normal part of the cycle of capitalism. Regardless of the noise and negative headlines things have improved over time, and difficult times in markets often yield great long term investment opportunities.
Whatever happens, we will continue to protect your capital and monitor events to take advantage of any opportunities that arise.
While a rapid rise in Treasury yields through mid-October threatened to derail investors’ holiday cheer, the Fed swept in like Santa Claus, delivering an early present to investors: dovish December dot plots suggesting rate cuts were in store for 2024. Yields quickly retreated as traders moved to price in twice as much easing as the Fed had tipped, leading to a solid quarter for stocks and bonds, alike. Below, we highlight themes and data the team at Rayliant is following going into the new year, opining on the prospect of rate cuts and how much of that good news might already be baked into prices.
Equities
After showing weakness in the third quarter as yields surged and investors began questioning the soft- landing narrative, macro data throughout Q4 renewed markets’ confidence in the strength of the US economy, culminating in a December FOMC at which the central bank revealed it was contemplating rate cuts in 2024. That last development, in particular, sent equities and other risk assets into rally mode going into the year end (see Figure 1). US stocks led the way, with the S&P 500 climbing 26.3% in Q4 as investors digested cooling inflation and that dovish pivot in the Fed’s messaging. Developed markets outside the US likewise posted impressive numbers, returning 22.8% for the quarter. Stocks in the UK and Eurozone, where economic conditions are a bit weaker than in the States, nevertheless rallied, rising by 7.9% and 15.8%, respectively, as inflation in those regions also cooled and markets moved to price more aggressive cuts. Concern over China’s economic growth and issues in its property sector dragged emerging markets lower, though EM stocks still managed to post a 10.3% gain in Q4.
Figure 1: Equity Market Performance, Returns as of 31 December 2023
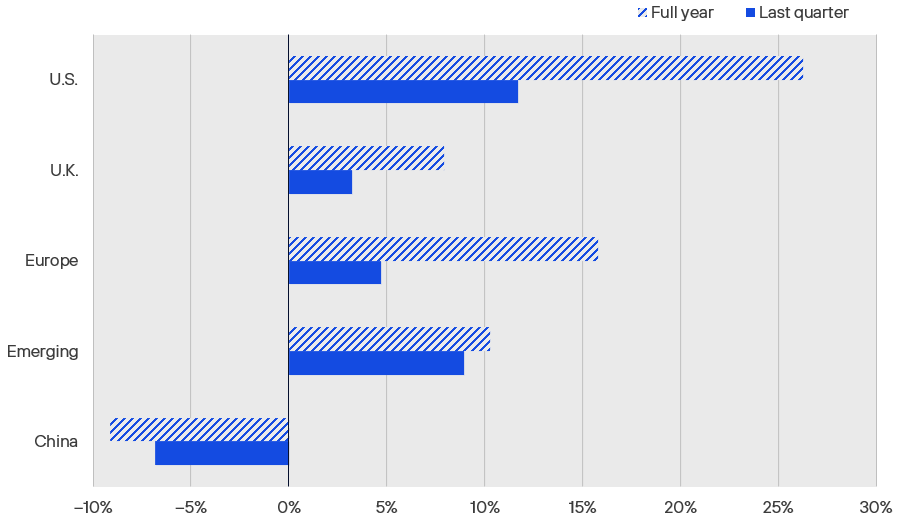
Source: S&P 500 (USD), FTSE All-Share (GBP), EURO STOXX 50 (EUR), MSCI Emerging Markets (USD), and CSI 300 (CNY), via Bloomberg.
For much of the last two years, all eyes have been on the Fed for clues as to where rates are headed, as the central bank balanced risk of complacency in its fight against inflation, on the one hand—easing too soon and letting prices reaccelerate—versus overshooting and leading the US into a hard landing. As the Fed’s December meeting has got investors thinking about what it might look like if rates come down in 2024, it’s worth noting that most easing cycles over the past three decades haven’t been too dramatic. Since 1990, the average sequence of cuts has taken around six months and featured just about nine 25-bps rate cuts before all was said and done (see Figure 2). We also note that most past cases of rate cuts, especially the deepest ones, were in response to serious economic downturns: not exactly where we find ourselves going into this year. While some analysts have pointed to a so-called “cardboard box recession” (see Figure 3), economic growth has been strong enough in 2023 to make one wonder how urgently the Fed will seek to pivot away from restrictive conditions this year.
Figure 2: Judging by Fed’s History, Easing Might Be Over Fast
As rates were on the way up, we looked to past episodes of tightening for clues as to how long it might last and how high they might go. Now, with the Fed messaging the potential for a few cuts in 2024—and markets pricing in a few more, still—it’s worth revisiting the central bank’s history, focusing on the nine easing cycles observed since 1990. The longest and deepest was the one that started in mid 1990, when the Fed slashed rates to mitigate the Gulf War recession; unemployment reached 7.8% two years after cuts commenced, helping to explain why the Fed remained accommodative for so long. In most cases, however, easing was short and sweet, illustrated by the most recent example: two cuts over a span of two weeks, lowering rates by 150 bps when COVID hit in early 2020.
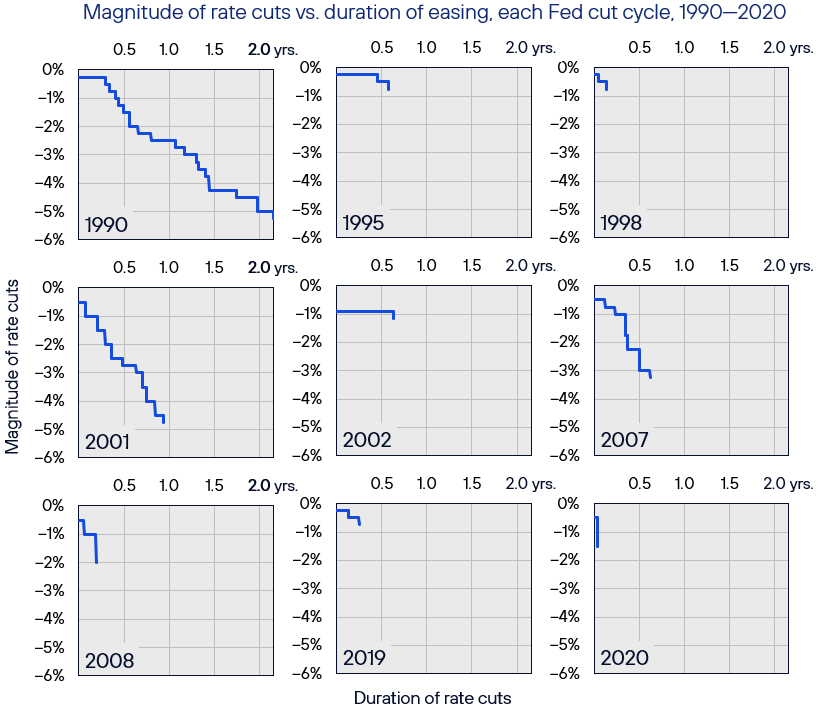
Source: Rayliant Research. US Federal Reserve, as of 31 December 2023.
Figure 3: Are We in the Midst of a “Cardboard Box Recession”?
Since the Fed began hiking in March of 2022, a range of economic signals have flashed warnings of an impending recession: from the Treasury yield curve—which inverted in July the same year and has remained so ever since—to The Conference Board Leading Economic Index, which tracks a range of macro variables and predicts a downturn ahead. One explanation for the US economy’s apparent resilience in the face of such gloomy data is that America did experience a recession, it was just much narrower than the type economists typically identify with a slowdown. That squares with growth in shipments of cardboard boxes, which usually plunges near a recession and has been deeply negative since late 2021. It also jibes with a contraction in US manufacturing, which last December entered its fourteenth month, offset by strength in the services sector, allowing the broader economy to stay above water.
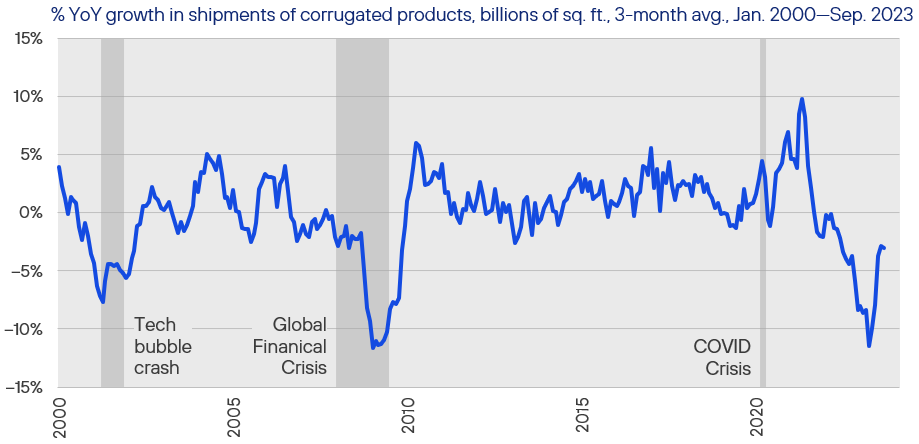
Source: Rayliant Research, Fibre Box Association, NBER recessions shaded, as of 31 December 2023.
Another question always worth asking, particularly after a big rally in risk assets like we witnessed to close out 2023: How much of the good news is already priced? Like many market participants biding our time in the last few weeks of December, typically slower and lower-volume due to the holidays, we amused ourselves with the annual pastime of reviewing major market strategists’ 2024 outlooks. Interestingly, the median Wall Street projection in late-December put stocks on course for a mediocre year ahead, predicting just a 2% return for the S&P 500 over the next twelve months (see Figure 4). While one must take such forecasts with a grain of salt—they’re wrong about as often as they’re right—we tend to agree that there’s a good deal of optimism being baked into equity prices at this point, such that this year’s stock returns may turn out to disappoint. That’s especially true of US growth stocks exemplified by the so-called “Magnificent 7,” which ended last year at almost 17% weight in the typical global equity investor’s portfolio (see Figure 5). While there are a number of those mega-caps we like, at valuations like these, we see prudence in global diversification. That applies to developed markets outside the US, though the case seems even stronger in EM, where shares boast more attractive prices relative to those in the US than at any time in at least the last thirty-six years (see Figure 6).
Figure 4: Wall Street Analysts See Modest Upside in 2024
Late in Q4, strategists at major investment firms posted their annual year-ahead outlooks for US stocks, with the median analyst predicting a 2% return on the S&P 500 in 2024. That’s quite a comedown from last year’s gains, though the median masks quite a bit of disagreement: JPMorgan expects stocks to close the year nearly -12% lower, while Oppenheimer’s bullish call puts stocks ahead over 9% by December. Such year-end forecasts always generate major buzz, making it all the more important to recognize how prone they are to error. At the end of 2021, for example, Wall Street forecast stocks to rise by 4% in 2022. The market was actually down 19% for the year. And last year’s 26% rally? Much better than the 6% gain analysts had penciled in at the end of 2022.
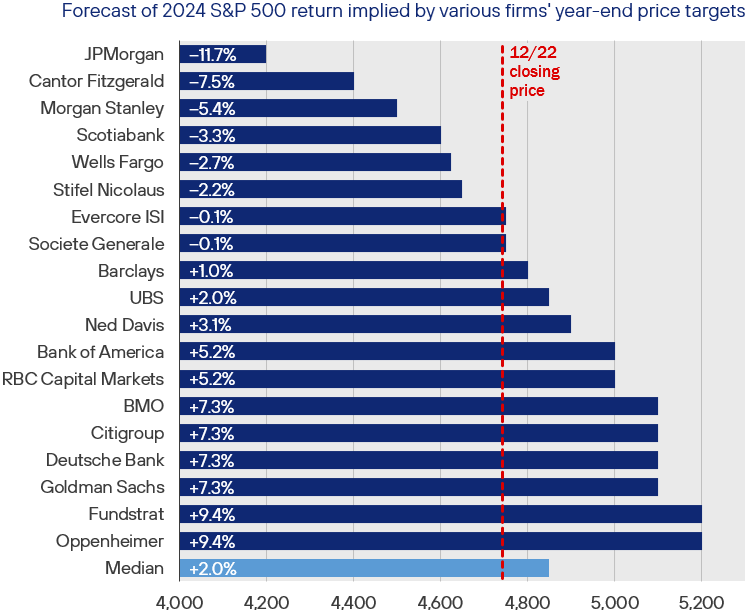
Source: Rayliant Research, Bloomberg, as of 22 December 2023.
Figure 5: Many Equity Portfolios Closed 2023 a Bit More Concentrated
US stocks rallied to end 2023 on a high note after the Fed signaled rate cuts might be in the cards for 2024. But the top weights in the S&P 500—dubbed the “Magnificent 7″—had already posted huge gains earlier in the year, as enthusiasm around AI catapulted tech valuations, sparking debate as to whether the theme had achieved bubble status. Regardless of one’s stance on that question, it’s hard to argue last year’s growth rally didn’t lead to a fair amount of concentration in global portfolios: By year end, those seven US stocks’ weight in MSCI’s ACWI Index had reached almost 17%, significantly more than what the same portfolio allocated to the next four largest developed markets, combined, and more than six times the weight in all of China, the world’s second-largest market.
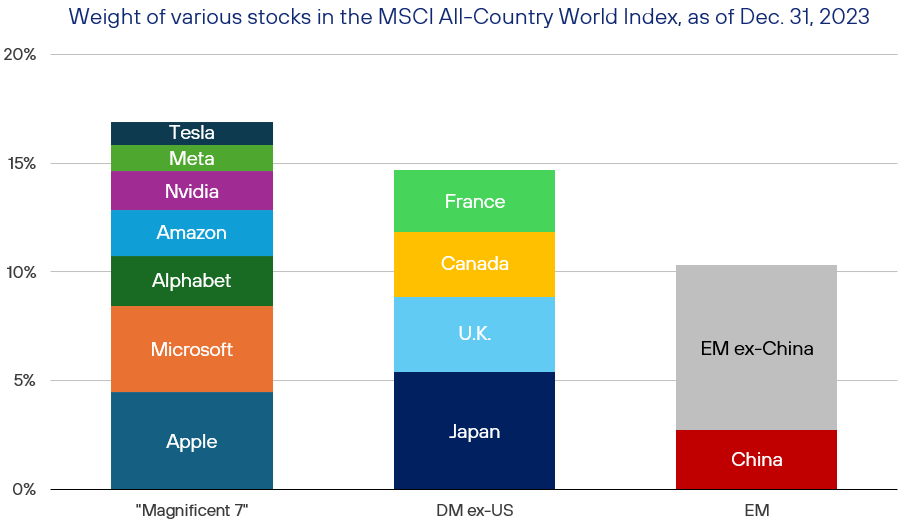
Source: Rayliant Research, MSCI, as of 31 December 2023.
Figure 6: Emerging Markets Looking Cheap vs. U.S. Stocks
Another way of visualizing the impact of 2023’s rally on US equities is to consider their valuation relative to other regions from an historical perspective. While emerging market shares traditionally trade at a discount to US stocks, never since MSCI data begin in late-1987 have EM stocks been priced as low against their US counterparts as in December 2023. Those looking for patterns will be drawn to the big decline in EM relative valuations in the late 1990s—a period marked by the run-up of America’s “dot-com” bubble—and a more protracted slide since around 2010, after which US stocks entered a long rally under the influence of ultra-low interest rates. Those concerned with US tech stocks’ valuation entering 2024 may favor a tilt toward more reasonably priced growth in EM.
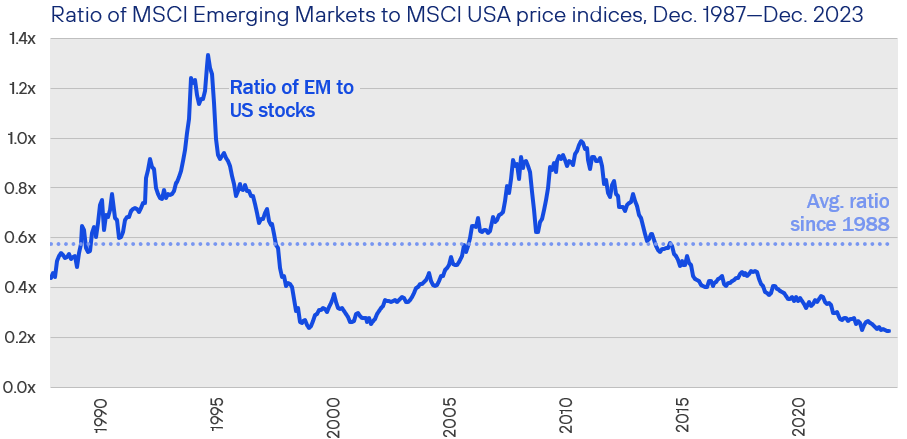
Source: Rayliant Research, MSCI, as of 31 December 2023.
Fixed Income
With talk of Fed rate cuts taking center stage at the end of last year, it’s no surprise that fixed income posted stellar performance, with yields falling and bonds rallying across the board in the fourth quarter (see Figure 7). As we alluded to before, at the heart of this sudden shift in sentiment on the part of fixed income investors in Q4 was a rather surprising revision to the Fed’s quarterly dot plots at its December FOMC, showing a concerted move from “higher for longer” thinking and contemplation of further hikes to tentatively penciling in three cuts by the end of 2024 (see Figure 8). Looking beyond Treasuries, and consistent with the outperformance of risk assets more generally, investment grade bonds and high yield credit outperformed in Q4, as investors bet that easing financial conditions would coincide with a soft landing and, ultimately, less fallout from previous tightening than had been feared—although, with credit spreads at lower-than-average levels throughout most of this cycle, we don’t see this as a great entry point in riskier parts of the market.
Figure 7: Fixed Income Market Performance, Returns as of 31 December 2023
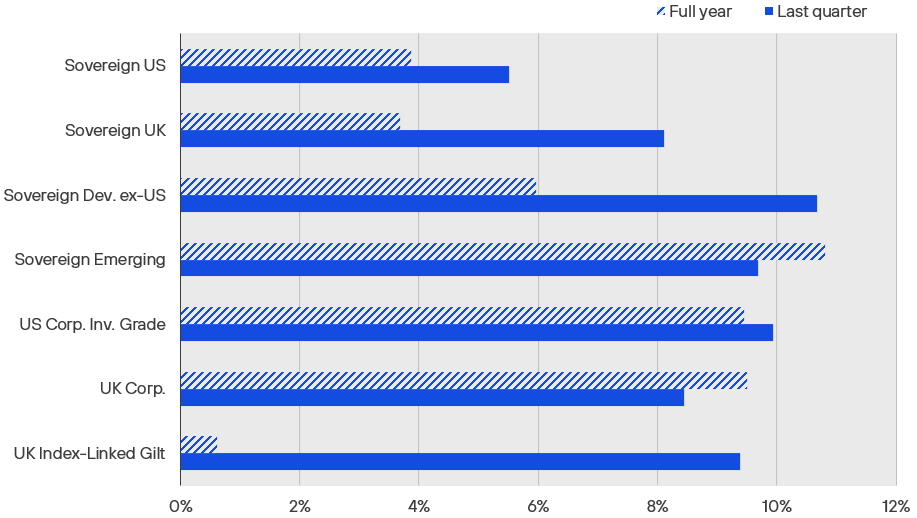
Source: ICE US Treasuries Core, FTSE Actuaries UK Conv. Gilts, S&P Int. Sov. ex-US, JPMorgan EMBI Global Core, iBoxx USD Liquid Inv. Grade, Markit-iBoxx GBP Liq. Corp., Bloomberg UK Gov. Inflation-Linked All Mat., expressed in USD, except for UK indices in GBP, via Bloomberg.
Figure 8: December Dot Plot Shows Pivot in Fed’s Thinking on Rates
Leading up to the FOMC’s December 13th meeting—its last chance to adjust rates in 2023—traders were pricing a 99.8% chance the Fed would hold rates steady: not much in the way of suspense. Instead, investors focused their attention on the quarterly “dot plot,” a visualization of where each committee member stands on the future path of policy rates. That chart was truly a shocker, with the median row changing from September to imply three rate cuts this year, a major departure from Fed chair Powell’s statement just before the pre-FOMC communication blackout period, that “it would be premature…to speculate on when policy might ease.” As has been the case throughout the current policy cycle, traders quickly rejected the Fed’s messaging, reacting by pricing in six cuts for 2024.
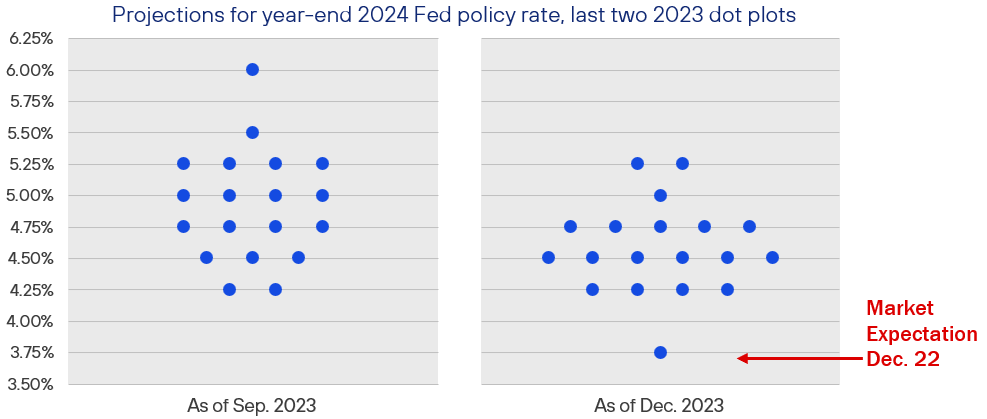
Source: Rayliant Research, FOMC, Chicago Board Options Exchange, as of 31 December 2023.
Entering December, we also didn’t see such a dramatic pivot in the Fed’s messaging coming. Financial conditions are actually quite loose at the moment, considering we’ve just absorbed 525 bps of rate hikes, not least because the market has been prone over the last two years to severely discount the Fed’s resolve. Naturally, as if on cue, traders swiftly reacted to the dot plots’ implication of three rate cuts in 2024 by pricing in another three more, bringing the total cuts implied by Fed funds futures this year to six, with easing expected to commence as early as March. While we believe it’s reasonably likely the Fed is done hiking at this point, whether or not we even get three moves down in the Fed funds rate this year will ultimately depend on the path of inflation and the strength of the US economy.
As such, despite a change in the Fed’s messaging, we believe their actual behavior will better match statements made by central bankers in Canada and Europe who, as of year-end, had not yet given in to investors’ plea for accommodation and still pledge a firm commitment to stomping out inflation—but whose markets have nevertheless also priced in aggressive easing in 2024 (see Figure 9). We suspect the easy gains against rising prices, mostly on the goods side, have been won, and that addressing the stickier service sector inflation will be a considerably bumpier road, perhaps upsetting the timeline suggested by those dot plots. As we’ve discussed at length elsewhere, we also see America’s fiscal position going into what promises to be an entertaining election year as putting upward pressure on yields and inflation beyond the Fed’s capability to easily fix, regardless of what it does with rates (see Figure 10). All of this leaves us considerably more bearish on longer-term bonds than the yield curve currently reflects.
Figure 9: Traders See Cuts Across Most Major Economies, Hikes in Japan
Just like the Fed, the European Central Bank (ECB), the Bank of England (BoE), and the Bank of Canada (BoC) held the line in their final meetings of 2023, keeping rates at elevated levels through December in a bid to further quell inflation—which was actually falling faster in the Eurozone than in the US leading into year end. In contrast to the Fed’s messaging pivot in the direction of easing, these other Western central banks refrained from signaling that the war against inflation might be over. The BoC’s December statement even cited policymakers’ willingness “to raise the policy rate further if needed.” That didn’t stop markets from pricing in hefty rate cuts for each of them in 2024, with the exception of Japan, where inflation is welcome and traders actually see modest tightening ahead.
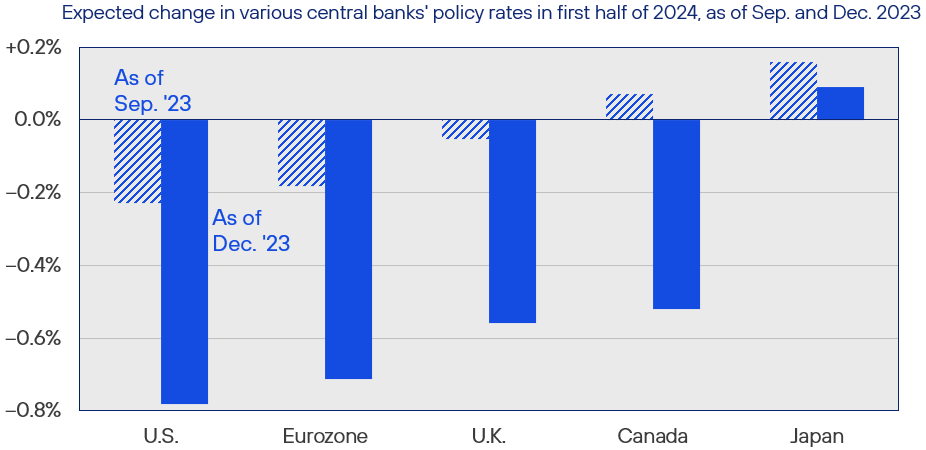
Source: Rayliant Research, Bloomberg, as of 30 September 2023 and 31 December 2023.
Figure 10: Ballooning National Debt Could Pressure Yields Higher
Although the prospect of rate cuts has driven a rally in Treasuries and pushed yields down from highs reached last October, Fed policy isn’t the only determinant of yields. Another important input to valuations is the risk investors associate with loans to the US government. When markets get anxious about America’s credit, investors demand a higher return on Treasuries and yields rise. That risk came into focus last summer, when Fitch downgraded US debt from AAA to AA+, citing America’s precarious fiscal position, as Congress projects the national debt blowing through levels reached at the height of World War 2 in the next three decades. We do see high expected Treasury issuance and worries that US politicians won’t rein in spending as continuing to exert upward pressure on yields.
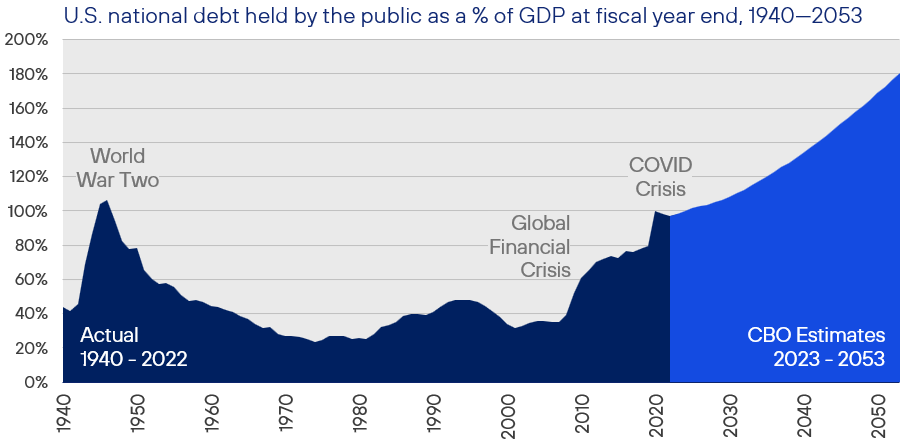
Source: Rayliant Research, Congressional Budget Office, as of September 2023.
Alternatives
After two consecutive years of strong performance for commodities in 2021 and 2022—years in which the Bloomberg Commodity Index posted total returns of 27% and 16%, respectively—the asset class finished 2023 on a down note, falling -4.6% in Q4, and -7.9% for the full year (see Figure 11). While rate cuts aren’t generally bad news for commodities (a weaking dollar could actually help among those settled in USD), most of last year was characterized by anxiety over global demand as manufacturing in many regions faced a contraction and weakness in China’s economy persisted. Despite tensions in the Middle East and OPEC+ supply cuts, energy prices slumped, with industrial metals and agricultural commodities also notching losses for the year (see Figure 12). One commodity that did benefit from expectations for Fed rate cuts was gold, which hit a record high price in December and boosted the precious metal sector to a gain of 9.6% for the year. Gold has historically performed better when rates are low, such that the opportunity cost of holding an asset generating no yield is less severe.
Figure 11: Alternatives Performance, Returns as of 31 December 2023
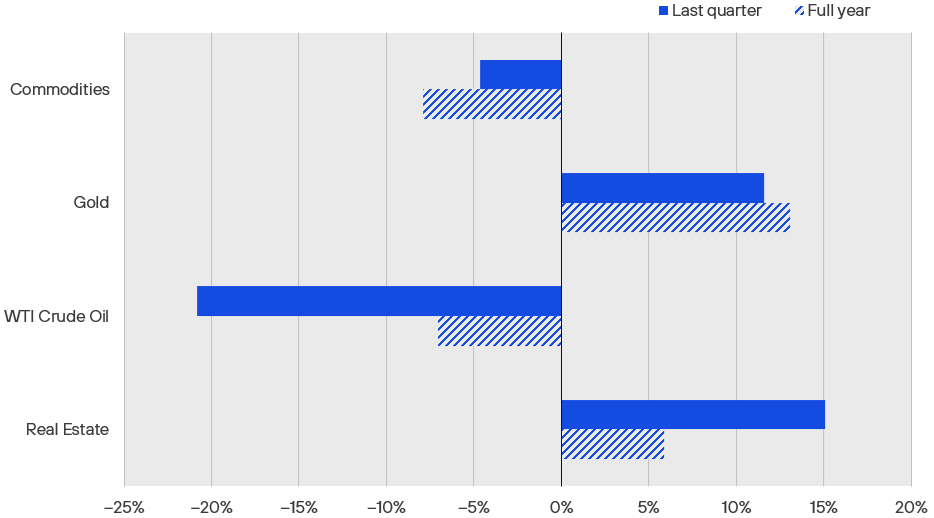
Source: Bloomberg Commodity Index, Gold Spot, WTI Crude, iShares International Developed Real Estate ETF, all expressed in USD, via Bloomberg.
Figure 12: After a Strong 2022, Commodities Struggled in 2023
After strong outperformance of commodities in 2022—a year in which the logistical disruption due to China’s zero-COVID policy set the stage for a massive shock to prices when Russia invaded Ukraine—the alternative asset class can perhaps be forgiven for delivering lackluster returns in 2023. Indeed, most sectors were down for the year, as markets processed Fed tightening and its implications for global growth, with China’s dismal pandemic reopening further weighing on expectations for commodity demand. One bright spot was precious metals, propelled by gold whose price hit a record high of $2,135/oz. in early December as escalating tensions in the Middle East combined with bets on Fed rate cuts and a weak dollar to drive investors’ interest in the non-yielding store of value.
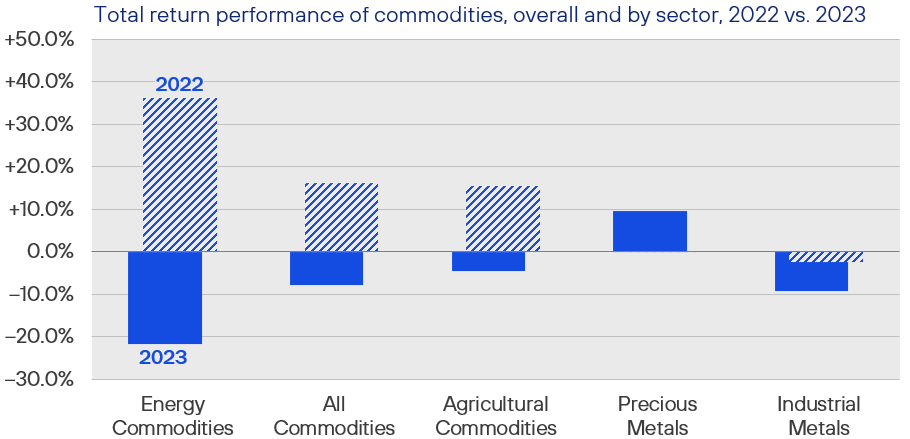
Source: Rayliant Research, Bloomberg Commodity Index and Sector Indices, as of 31 December 2023.
An alternative asset class with even greater interest rate sensitivity is the property market, for which a dovish pivot could not have come sooner. REITs are often used within an asset allocation to diversify a broader portfolio’s exposure, though rising rates over the last two years have been a major headwind. December’s shift in policy rate expectations led to a strong revaluation of real estate, with developed properties climbing over 15% in Q4, putting it firmly in the black for the year, up almost 6%. The bounce in real estate investments wasn’t uniform, with properties in the Industrial, Data Center, Lodging, and Specialty categories performing much better, for example, than those in the Office sector. That said, with the exception of Telecom—stifled by the effects of tight monetary policy on cell providers’ network expansion plans, finishing the year down modestly—every other property category registered gains for the year (see Figure 13). REITs may have more room to run, according to research on every Fed policy cycle since 1990, conducted by real estate industry association Nareit, which found that in the four quarters after a tightening cycle ends, public real estate funds have outperformed the S&P 500 by an average of 10.4%.
Figure 13: Last Year’s Rebound in REITs Wasn’t Evenly Distributed
Not surprisingly, given REITs fall at the intersection of the financial and property markets, the Fed’s move in 2022 to aggressively raise rates led to losses for the asset class, with nearly every sector tracked by Nareit posting double-digit negative returns that year (the Specialty and Gaming segments were essentially flat). Near the end of last year, when the US central bank seemed to give in to investors’ calls for a start to easing, real estate reversed course, sending most sectors of the market into the black for the full year in 2023. Among the worst performers in 2022, Office properties—still reeling from changes to the way Americans work post-pandemic—only managed a modest rebound, while Industrial powered back, and Data Centers ended the year with a whopping 30% return.
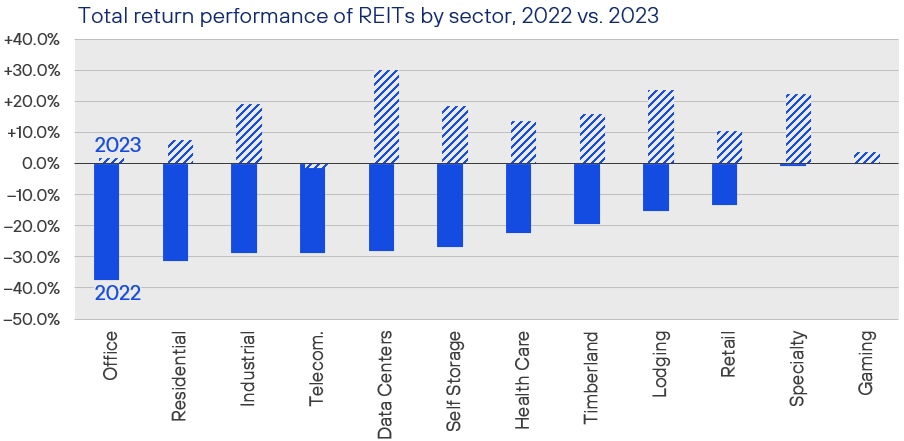
Source: Rayliant Research, Nareit, as of 31 December 2023.
Economic Calendar
Key Economic Releases and Events for 2023 Q4
United Kingdom
Bank of England Official Bank Rate Release: 1st Feb., 21st Mar.
GDP Figures: 15th Feb., 28th Mar.
PMI Figures: 1st Feb., 5th Mar.
CPI Figures: 14th Feb., 20th Mar.
Eurozone
ECB Monetary Policy Meeting: 25th Jan., 7th Mar.
GDP Figures: 30th Jan.
PMI Figures: 24th Jan., 22nd Feb., 21st Mar.
CPI Figures: 22nd Feb., 18th Mar.
United States
FOMC Rate Decision: 31st Jan., 20th Mar.
GDP Figures: 25th Jan., 28th Feb., 28th Mar.
PMI Figures: 1st Feb., 1st Mar.
CPI Figures: 13th Feb., 12th Mar.
Important Information
The information contained in this article is the opinion of Henderson Rowe and does not represent investment advice. The value of investment may go up and down and investors may not get back what they invested. Past performance is not an indicator of future performance.
This document is intended for the use and distribution to all client types. It is not intended for distribution to, or use by, any person or entity in any jurisdiction where such distribution would be unlawful and participation in the portfolio referred to herein shall not be offered or sold to any person where such sale would be unlawful. Any onward distribution of this factsheet is strictly prohibited.
The value of investments and the income from them can go up as well as down and you may realise less than the sum invested. Some investments may be subject to sudden and large falls in value and you may realise a large loss equal to the amount invested. Past performance is not an indicator of future performance. If you invest in currencies other than Sterling, the exchange rates may also have an adverse effect on the value of your investment independent of the performance of the company. International businesses can have complex currency exposure.
Nothing in this document constitutes investment, tax, legal or other advice by Henderson Rowe Limited. You should understand the risks associated with the investment strategy before making an investment decision to invest.
Investors should be aware of the risks associated with data sources and quantitative processes used in our investment management process. Errors may exist in data acquired from third-party vendors, the construction of model portfolios, and in coding related to the index and portfolio construction process. Information contained in this fact sheet is based on analysis of data and information obtained from third parties. Henderson Rowe Limited has not independently verified the third-party information. The firm, its directors, employees, or any of its associates, may either have, or have had, a position, holding or material interest in the investments concerned or a related investment.
Henderson Rowe is a registered trading name of Henderson Rowe Limited, which is authorised and regulated by the Financial Conduct Authority under Firm Reference Number 401809. It is a company registered in England and Wales under company number 04379340.


