Despite the Fed delivering a mid-December rate hike and signalling more to come in 2023, U.S. stocks in the S&P 500 delivered a ‘Santa Claus rally’ for the seventh year in a row. In fact, it was a strong end to a year that most investors would like to forget, as increasing hopes for falling inflation, an economic soft landing, and an end to restrictive central bank policy spurred a rally in stocks and bonds. In our latest Quarterly Asset Class Update, we break down the data behind a number of competing themes in today’s macro environment, highlighting what investors might expect in the year ahead.
Asset Classes
Equities
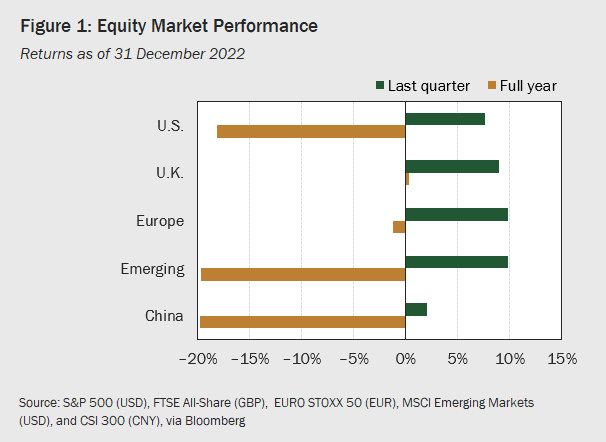
All eyes were once again on inflation and Fed policy in the fourth quarter, as investors looked for signs that the central bank’s campaign against rising prices might be reaching an inflection point. Ultimately, markets concluded Chairman Powell’s continued emphasis on the need for further restrictive policy was cheap talk, interpreting softening inflation and the Fed’s decision to step down its December hike from 75 to 50 bps as evidence peak policy rates—and even rate cuts—could be on the horizon. Never mind the fact that December’s CPI, showing a 6.5% year-over-year increase in prices, while down from 7.1% in November, was still a far cry from the Fed’s 2% target; nor the fact that the December FOMC dot plot revealed committee members’ projection that rates would max out at 5-5.25%, considerably higher than the 4.5-4.75% range forecast one quarter prior. Equity investors saw the glass half full and bid markets up (see Figure 1). U.S. shares ended the quarter +7.6% higher, while developed stocks outside the U.S. rallied by +16.3%, benefiting from a weakening dollar and rallying European markets, as the ECB and Bank of England also slowed the pace of tightening into the end of the year. Emerging markets gained +9.8% in Q4, also riding dollar weakness, along with China’s surprise reopening, which put its CSI 300 Index up +2% by quarter-end, well above lows reached in late October.
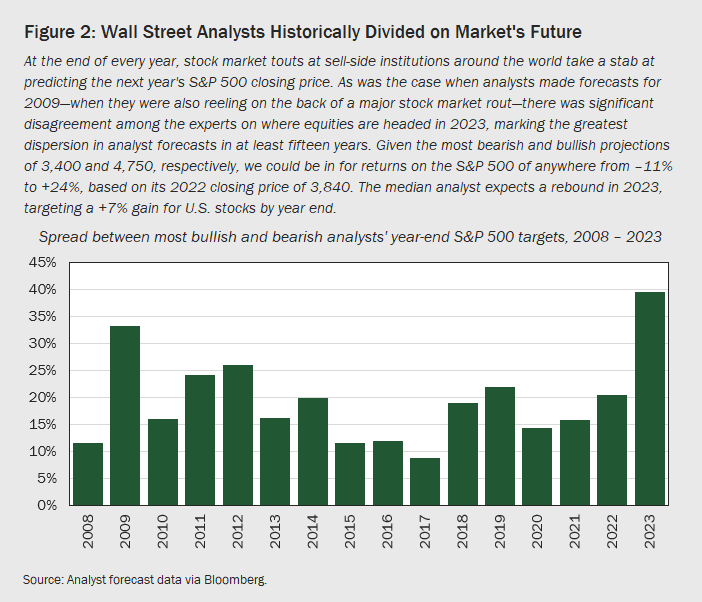
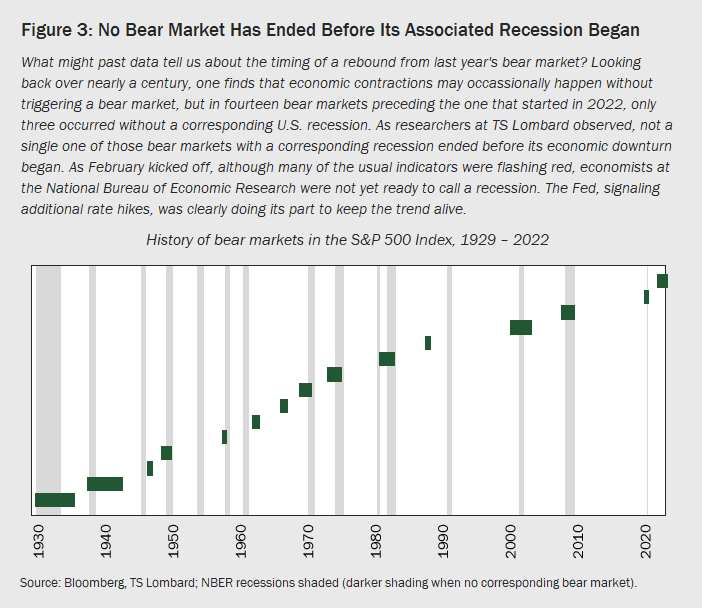
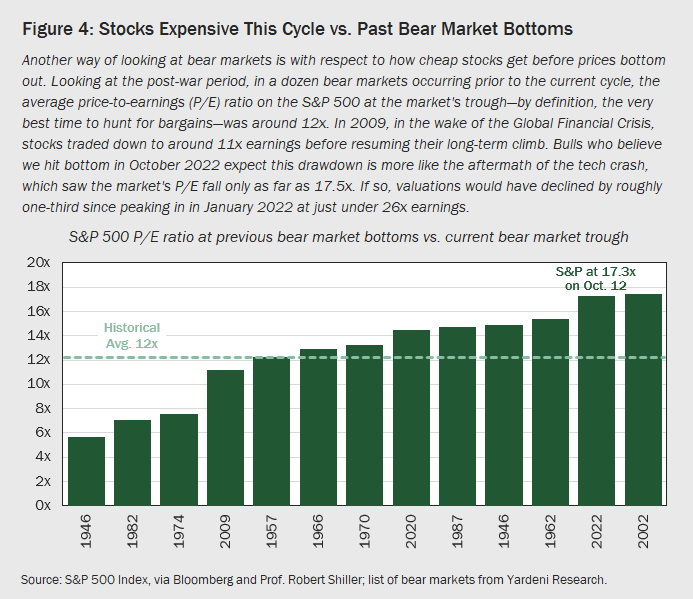
Of course, stocks’ gains in Q4 came as little consolation to those long the market, suffering through one of the worst years in recent memory for global equities. Going into the new year, there was serious disagreement as to whether the year-end rally marked a turning point for stocks or merely a ‘dead cat bounce’ on the way to lower valuations. Sell-side analyst forecasts made at the end of December for this year’s S&P 500 returns predicted anything from an –11% decline to a +24% gain in 2023, marking the biggest spread in Wall Street projections since 2009 (see Figure 2). Researchers at TS Lombard offered an interesting perspective on last year’s bear market, noting that starting with the Great Crash of 1929, in not one of the prior eleven bear markets stemming from a recession did the bear market bottom out before its corresponding recession began (see Figure 3). Thus, if a recession is in store for the U.S. economy, we might expect stocks to fall further before the true recovery begins. That account jibes with data on valuations at past bear market troughs, in which P/E ratios have typically bottomed out around 12x—far lower than the 17.3x low registered on October 12th, when the S&P 500 began its fourth quarter rebound (see Figure 4).
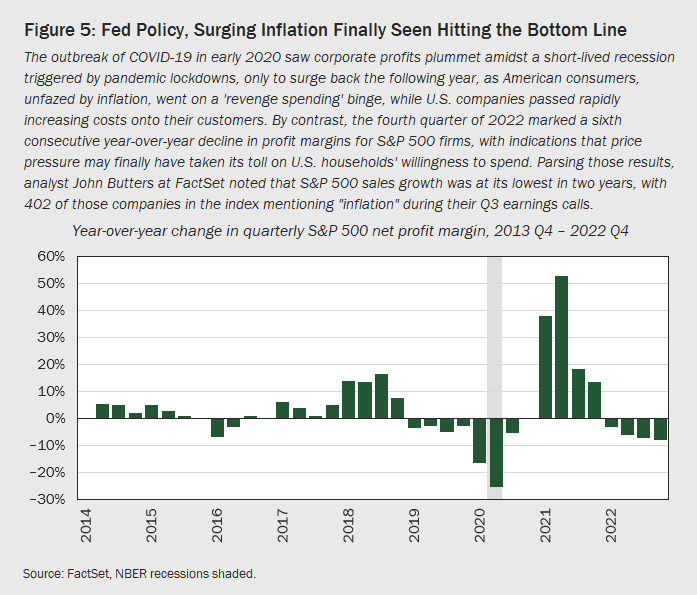
Given these considerations, if a recession is in store, one might reasonably expect a better equity entry point for investors with cash on the sidelines. While the U.S. economy has proven remarkably resilient in the face of brutal inflation and contractionary Fed policy, there are signs that the tide may be turning back in the bears’ favor. As many observers have noted, much of the economy’s strength over the last year has come on the back of American households, whose relentless consumption in the face of rising prices has allowed companies to pass higher costs off on customers to maintain record profitability. Now, U.S. consumers’ willingness to bear the brunt of inflation seems to be wearing thin, as S&P 500 profit margins saw their sixth consecutive year-over-year decline, with four in five firms citing inflation when explaining themselves on Q3 earnings calls (see Figure 5). As the denominator in P/E ratios—already unusually high at this point in the cycle—declines further, equity valuations become that much harder to justify, and the bear market’s end feels that much less certain.
Fixed Income
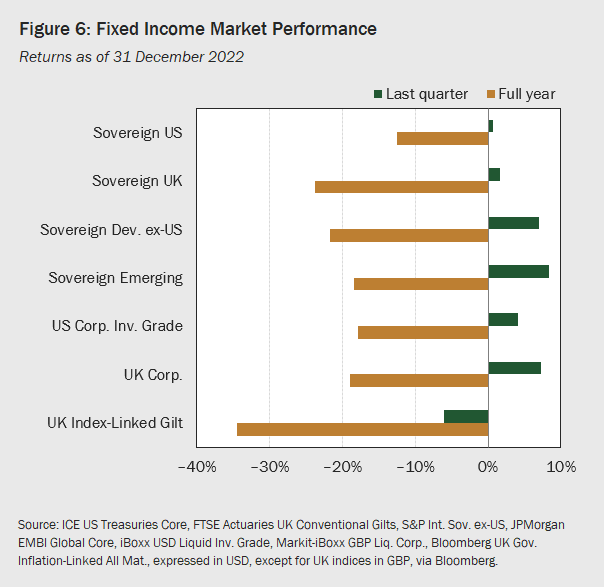
Improving sentiment around central bank policy also gave a boost to bond markets, as hope that rate hikes would soon pause and the dream of a ‘soft landing’ sent investors into ‘risk on’ mode, in search of higher yield. Consequently, Q4 saw a broad rally in fixed income markets, with higher-risk segments of the market posting the best results (see Figure 6). Corporate outperformed sovereign, high yield marched ahead of investment grade, and international bonds—particularly EM debt—performed best of all, catching an additional tailwind from a weakening dollar. Unfortunately, one strong quarter was far from enough to undo central banks’ rapid rate hikes of the prior three quarters, and fixed income performance for the full year, as measured by Bloomberg’s U.S. Aggregate Bond Index, was the worst on record since that index launched in 1976.
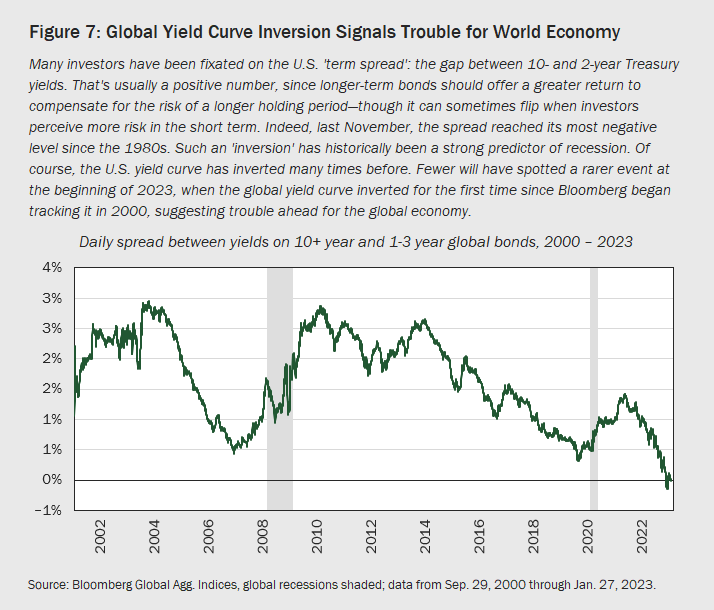
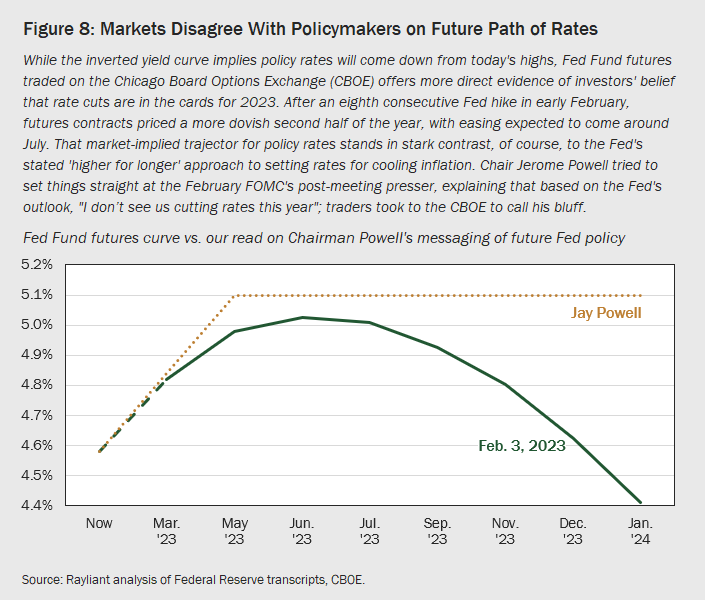
In fact, we have been racking up the superlatives in bond world—sadly, most of them negative. Never before, for example, had the global yield curve inverted, though that was precisely what happened in January, when the spread between 10+ year and 1-3 year global bonds went negative (see Figure 7). Investors had been keeping a close watch on the U.S. yield curve, which first inverted in April 2022 and, in November, reached its most extreme inversion since the 1980s, suggesting a high likelihood of recession in 2023. The prospect of a severe economic downturn could explain why traders of Fed Fund futures are convinced policy rates will start coming down in the second half of this year, despite Fed officials’ insistence that they will stick to a ‘higher for longer’ approach (see Figure 8). On the other hand, as the outperformance of high yield implies, credit spreads actually contracted in Q4: not exactly screaming ‘deep recession’ from investors’ perspective.
A more plausible read on the market’s view that rates will begin to come down well ahead of the Fed’s timeline is that traders see inflation reverting to a comfortable range far sooner than the central bank’s economists. Observing the steep decline in freight rates and measures of supply chain disruption, two of the prime suspects behind the last couple years’ surging prices, it’s easy to see why investors would have that perception (see Figure 9). Inflation has certainly come down from its June 2022 peak, though digging a bit deeper, it’s really core goods inflation that receded—where one would expect to see some relief as supply chain problems resolve—while rising core services prices, known to be a stickier source of inflation, were still going strong into the year end. That explains the Fed’s increasing preoccupation with jobs data, as record high employment and a rebound in capacity utilization promise to continue exerting pressure on wages and prices (see Figure 10), and calls into question the market’s aggressive timetable for a central bank policy pivot.


Alternatives
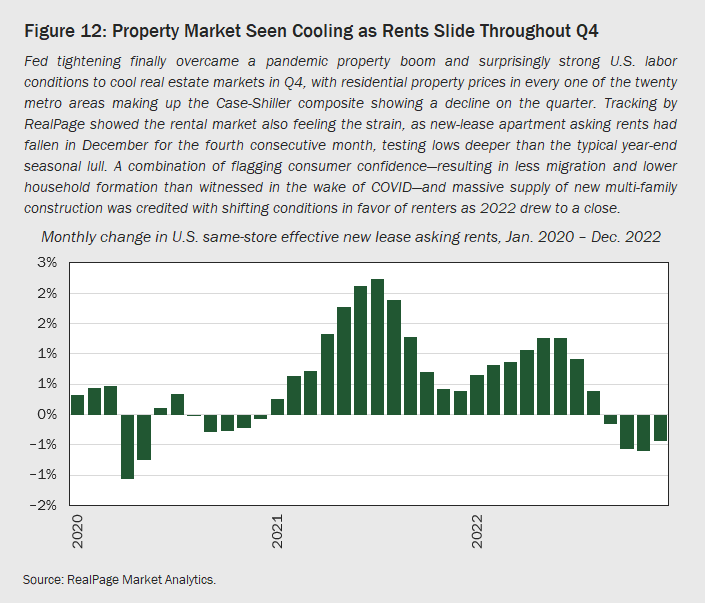
Given strong returns in equity and fixed income, Q4 performance was relatively muted in alternatives space (see Figure 11). Developed markets real estate gained +10.7% for the quarter, though it wasn’t enough to salvage the worst year for properties since 2008 as Fed tightening led to a severe reduction in real estate activity. And although REIT returns ended the year on a positive note, elements of both demand and supply were clearly taking a toll on real estate prices and market rents (see Figure 12), which tumbled in the final few months of the year. While such trends won’t be welcomed by property investors, they will please members of the FOMC, as rent is the largest component within core CPI. Due to lags in data collection, inflation will register these easing shelter costs in due time. Ultimately, given the underlying strength of the U.S. economy—including labor markets—along with most property owners having locked in ultra-low rates prior to rate hikes commencing, we see minimal risk of severe price declines. As investors gain more clarity around the Fed’s policy rate endgame, mortgage rates should come down further, stimulating more activity.
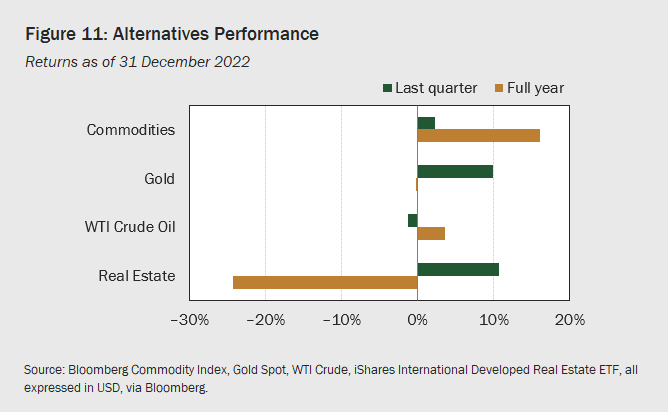
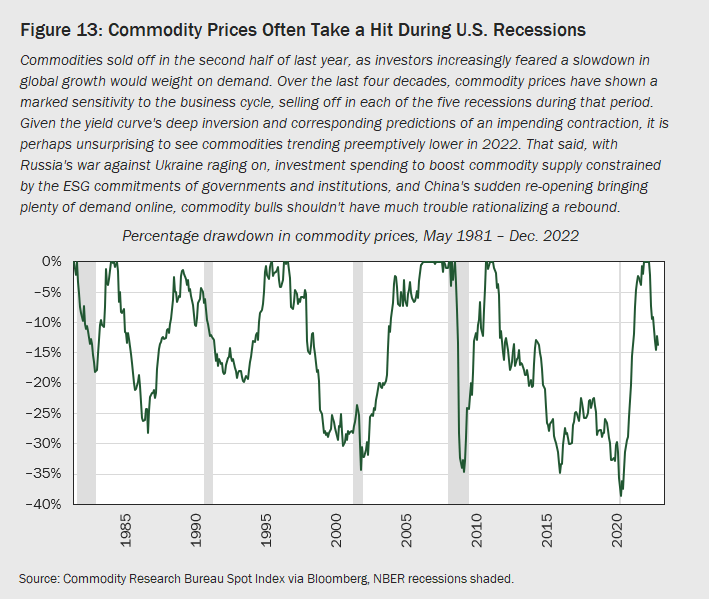
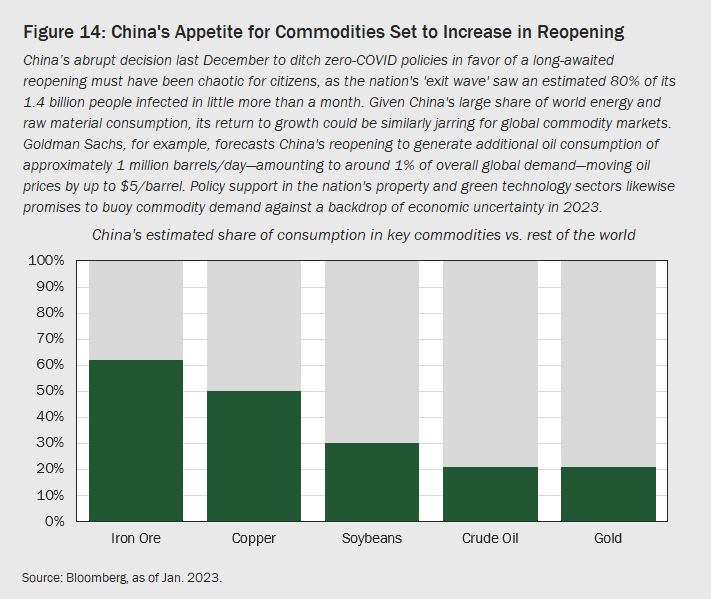
Commodities ended 2022 with mixed but generally positive results in Q4, driven primarily by the U.S. dollar weakening, but also perception that a deep recession had become less likely. On the latter point, we note that commodities do tend to be quite cyclical, posting losses during each of the last five U.S. recessions (see Figure 13). That said, even if the economy does experience a meaningful contraction in 2023, there are a number of supply-side effects working in commodities’ favor, including Russia’s ongoing war against Ukraine and a trend toward socially responsible investment that has meaningfully constrained firms’ ability to finance expansion of capacity, particularly in the energy sector. On the demand side, the biggest story in Q4 was clearly China’s hasty decision in December to scrap its zero-COVID policies in favor of a broad economic reopening, a development which promises to reactivate the nation’s insatiable appetite for raw materials, offering some support for commodity prices amidst a possible slowdown in global growth later this year (see Figure 14).
Key Economic Releases & Events for Q1 2023
UNITED KINGDOM
Bank of England Official Bank Rate Release: 23rd March
GDP Figures: 10th February, 31st March
PMI Figures: 21st February, 1st March, 24th March
EUROZONE
ECB Monetary Policy Meeting: 16th March
GDP Figures: 14th February, 8th March
PMI Figures: 21st February, 1st March, 24th March
UNITED STATES
FOMC Rate Decision: 22nd March
GDP Figures: 23rd February, 30th March
PMI Figures: 1st March
CPI Figures: 14th February, 14th March
Important Information
The information contained in this article is the opinion of Henderson Rowe and does not represent investment advice. The value of investment may go up and down and investors may not get back what they invested. Past performance is not an indicator of future performance.
This document is intended for the use and distribution to all client types. It is not intended for distribution to, or use by, any person or entity in any jurisdiction where such distribution would be unlawful and participation in the portfolio referred to herein shall not be offered or sold to any person where such sale would be unlawful. Any onward distribution of this factsheet is strictly prohibited.
The value of investments and the income from them can go up as well as down and you may realise less than the sum invested. Some investments may be subject to sudden and large falls in value and you may realise a large loss equal to the amount invested. Past performance is not an indicator of future performance. If you invest in currencies other than Sterling, the exchange rates may also have an adverse effect on the value of your investment independent of the performance of the company. International businesses can have complex currency exposure.
Nothing in this document constitutes investment, tax, legal or other advice by Henderson Rowe Limited. You should understand the risks associated with the investment strategy before making an investment decision to invest.
Investors should be aware of the risks associated with data sources and quantitative processes used in our investment management process. Errors may exist in data acquired from third-party vendors, the construction of model portfolios, and in coding related to the index and portfolio construction process. Information contained in this fact sheet is based on analysis of data and information obtained from third parties. Henderson Rowe Limited has not independently verified the third-party information. The firm, its directors, employees, or any of its associates, may either have, or have had, a position, holding or material interest in the investments concerned or a related investment.
Henderson Rowe is a registered trading name of Henderson Rowe Limited, which is authorised and regulated by the Financial Conduct Authority under Firm Reference Number 401809. It is a company registered in England and Wales under company number 04379340.