“See, Louis bet me that we couldn’t both get rich and put y’all in the poor house at the same time.
He didn’t think we could do it. I won.”
—Trading Places
Summary
-
-
- The bond market starts to struggle with indigestion, but value is starting to emerge.
- Our portfolio position has paid off during the past quarter: whilst there may be a seasonal rally, we remain cautious.
- As we predicted last year, the current UK government appears to be heading for a devastating election loss.
-
The last few months saw the traditional summer lull in equity markets. Unusually we saw an increase in problems in the world’s bond markets. For most of the past 40 years, bonds have tended to benefit from weakness in equities.
Worse, since the end of summer and the restart of massive debt issuance programs, we have seen a marked rise in the yields that profligate governments must pay to buy their debt.
This poor performance and increased volatility have led some markets to recommend buying equities in “safer” large US tech firms instead. Trading places, indeed.
For regular readers, you’ll know this weakness in bonds came as no surprise to us. Despite being the consensus “trade of the year” amongst professional investors, bonds have poorly performed so far to date. Indeed, at time of writing they have continued to selloff.
Ultimately this is a problem. Government debt performs the role of a “safe” asset which riskier securities are priced off. If governments are having to pay more for their borrowing, then so does literally everybody else. This will pass through into the financial economy through thinner corporate margins, higher financing costs and reduced equity valuations. It will also impact the real economy through reduced demand and higher costs.
More Brooke Bond than James — The Bond Market Is Doing Extremely Badly
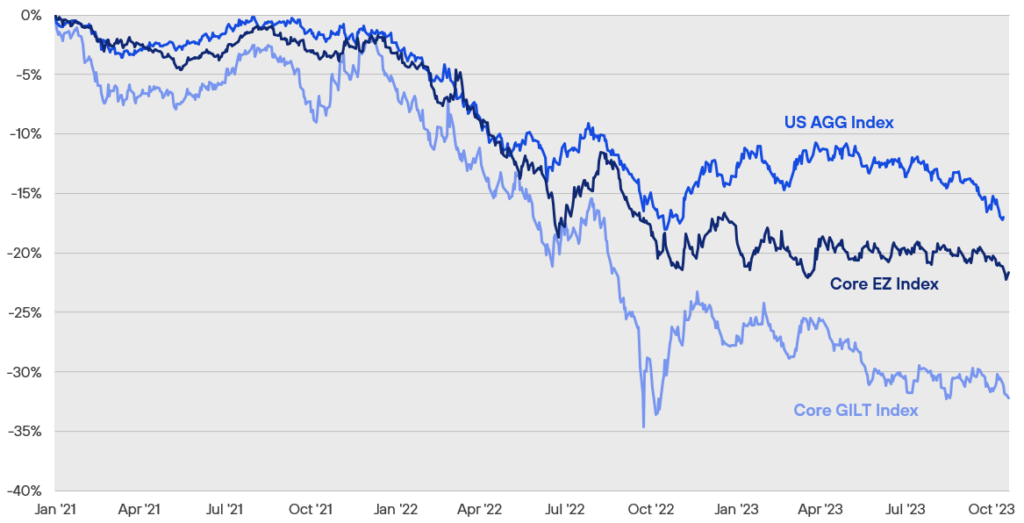
Source: Bloomberg, Henderson Rowe.
“Nobody wants to buy your drugs here, Louie.
Why don’t you just go away?”
—Trading Places
As we identified at the beginning of the year there are many reasons for this bond weakness:
First was investor crowding. As we mentioned at the beginning of the year, the market was anticipating a large and imminent recession which has yet to happen. Worse, from their perspective, was that Central Banks continued to raise rates thereby making longer dated bonds look less attractive.
Second has been ultra-low rates. The last decade has seen multi-century lows in interest rates. This long period of Zero Interest Rate Policy (ZIRP) had inured many recent market participants to what constitutes more usual long-term rates. We are only now beginning to approach levels that are normal over the past decades.
Yet this assumes inflation returns to the targeted 2% level. Very simplistically: to contain inflation, interest rates need to be about 1% above the inflation rate. So, if the UK manages to get to 2% inflation it will need a 3% Bank of England base rate. Again, very simplistically this suggests a 10 Year bond yield of 4.5%. Which is where we are now.
However, UK inflation is allegedly in the 6% range, which suggest rates would need to be 7% plus. As we have repeated highlighted, we did not think the UK economy could bear these levels of rates and it appears neither does the Bank of England, who have indicated they are close to the end of their hiking cycle with rates at 5.25% which is below the level of inflation. The FX markets reacted accordingly, and we have seen a sharp selloff in GBP.
So, the Bank of England is in a difficult position. They appear to have stopped raising rates well below the level of inflation – which is somewhat against orthodoxy – and now must hope they have done enough for inflation to fall. In fairness, they are continuing their policy of Quantitative Tightening – which is selling bonds back to the market and extracting cash – which will help. But this is not without its risks too, as I explain below.
Finally, massive supply. The US and other countries’ deficits are out of control. Nobody knows what the ultimate limit to government debt loads are. It also varies by country and time period. The bond markets are finally waking up to the fact that basic supply and demand suggests huge supply means rates must move higher to attract in more buyers.
What is more remarkable about government deficits is that we are not even in a recession. The next large recession is likely to push these deficits even higher. Will the bond markets be prepared to finance this? We honestly don’t know.
Living on the Never, Never — Global Debt Levels Continue to Soar
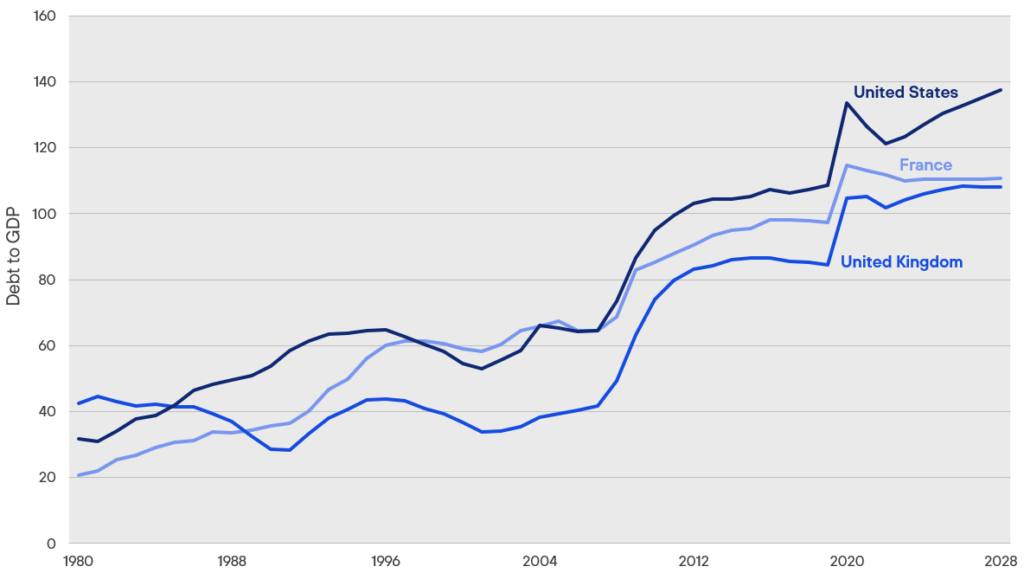
Source: IMF and Federal Reserve.
Normally, this is the process that forces governments to finally cut their largesse. Though given our political class is unlikely to want to take these tough decisions – such as a massive restructuring of the welfare state – we are likely to get more destructive tax increases and currency weakness before then.
Sunak — Still Useless
Indeed, we saw this at the recent Party conferences. Sunak is living up to our low expectations and – as we suspected – has no idea how to get the economy moving. His three big “announcements” of pointless tinkering with the education system, an unenforceable smoking ban or cancelling infrastructure projects – with no replacements – is hardly the stuff of legends.
By contrast the Labour Party has lots of ideas but none of them appear to be any good. Being the usual mixture of more debt and counterproductive taxes. We suspect the bond market is unlikely to want to finance their various policies.
As we saw from the recent Tamworth & Mid-Beds by-election results, the Conservatives could well be on for an extinction-level event next year. That said, a detailed reading of the results showed there wasn’t much enthusiasm for Labour either as the results showed many previously Conservative voters failing to turn up, and a significant portion of those that did voting for right wing parties.
Ultimately, if Labour is serious about being more than a one term party then in the same way “only Nixon could go to China,” then only Labour can fix the welfare state and dysfunctional NHS. We suspect they will fail and any Starmer administration will bear a resemblance to the Callahan one of the late 1970s.
So while UK equities are cheap, we still think there are better alternatives elsewhere. Also, we believe holding off until the next government is likely to be worthwhile.
The Portfolio Performance
As hopefully you have noticed from your statements, the patience and prudence in the portfolio has begun to pay off. As market conditions have deteriorated, our outperformance1 has begun to increase which – given the fact we have taken significantly less market risk with your money to achieve this – has justified our prudence and caution.
We have also continued to simplify the portfolio and started to reduce some of the US dollar overweighting.
Whilst we have positive capital growth for the year, we would – like you – like to see it strengthen further in the coming months. However, navigating bear markets is hard and requires patience to preserve your wealth for when real bargains start to appear. We believe that time is near, especially in parts of the bond market.
“I used to think that if there was reincarnation, I wanted to come back as the president or the pope or as a . 400 baseball hitter. But now I would like to come back as the bond market. You can intimidate everybody.”
—James Carville
Wait, Bonds Are a Buy Now?
Given the back up in yields, a question we often ask ourselves is whether bonds are a buy now? The accurate but not particularly helpful answer is that “it depends”.
It is important to remember that there is no one bond market just like there is not one housing market. The home buying conditions in Brighton can be very different than in Liverpool, for example.
The bond market is no different. We are beginning to see some attractive investments in select parts of the bond market and especially in certain classes of corporate debt. However, given a lot of the attraction is due to high cash yields, we are investigating ways to better capture this inside the portfolio.
“Right on time.
I’ll bet you thought I’d forgotten your Christmas bonus.”
—Trading Places
Looking Forward
Traditionally, the run up to Christmas is one of the strongest times of the year for portfolio performance. Indeed, many of our peers are very much banking on this to rescue their performance.
We have no strong view here. Chasing a short-term rally based on such ephemeral seasonal data goes very much against our prudent ethos. Given the volatility in government bond markets It seems likely that there will be more signs of problems at some point. Whether this will be this side of Christmas or in 2024 remains to be seen. As usual, we will watch & await developments.
After stocks posted big gains in the first half of the year on signs inflation was easing and loud calls for a “soft landing,” the mantra in Q3 abruptly shifted to “higher for longer,” as investors seemed to finally internalize the Fed’s hawkish messaging—helped, no doubt, by a dot plot out of the September FOMC suggesting another rate hike might be in the cards before year end. Rising Treasury yields rained on the stock market’s parade and resulting in losses across both equities and fixed income. Below, we highlight themes and data the team at Rayliant has been tracking entering the final quarter.
Equities
The growth rally that delivered such impressive gains for global stocks in the first half of the year fizzled out during the last three months, with equities in most major markets ending September down for the quarter as concerns over high interest rates finally began to sink in (see Figure 1). US stocks declined by –3.3% in Q3, which was better than most other developed markets equities, but largely because of dollar strength on the hawkish outlook for Fed policy. Value stocks held a modest advantage over growth shares for the quarter, while at the sector level, energy names were by far the biggest winners, benefiting from rising oil prices over the last three months. Not surprisingly, stocks with the greatest sensitivity to interest rates—including those in the real estate, utility, and IT sectors—saw the biggest losses during Q3. To that point, an equally weighted basket of the “Magnificent 7” stocks, responsible for nearly all of the S&P 500’s stellar first-half return, ended the quarter down –1.3%.
Figure 1: Equity Market Performance
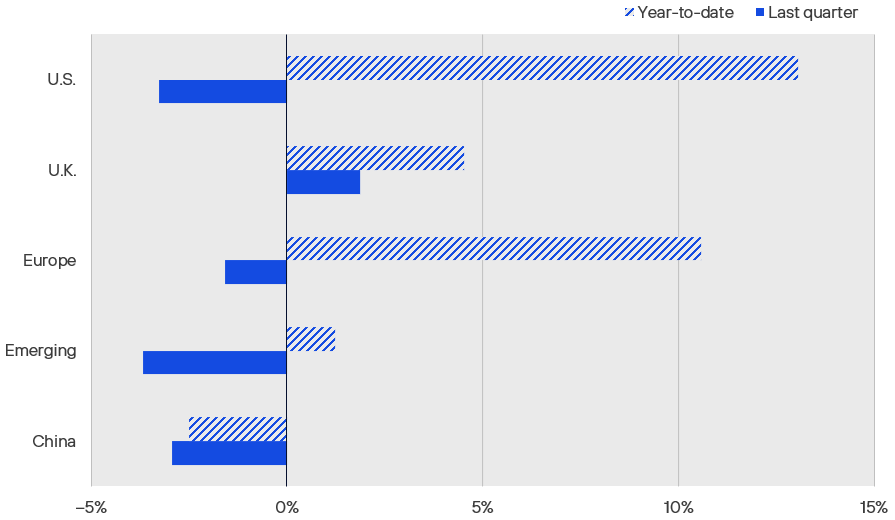
Source: S&P 500 (USD), FTSE All-Share (GBP), EURO STOXX 50 (EUR), MSCI Emerging Markets (USD), and CSI 300 (CNY), via Bloomberg. Returns as of 30 September 2023.
While other developed markets generally accompanied the US lower, UK stocks actually managed to pull off a gain in Q3, in no small part due to that market’s heavy tilt toward the energy sector, but also hopes the Bank of England might be finished hiking with inflation trending down and domestic growth quite vulnerable. Japanese shares slumped in Q3, as the Nikkei 225 Index lost –3.4%, with messaging by the BoJ and speculation on the part of traders that Japan’s negative interest regime might be nearing an end. Emerging markets also suffered during the quarter, as increasing risk aversion, the prospect of tighter Fed policy and a stronger US dollar, as well as continuation of China’s property sector woes loomed large—though we note that there were signs near the end of Q3 data on the world’s second largest economy might finally be turning the corner.
Turning back to the US, the third quarter’s market weakness was decidedly not due to a lack of growth. Most pundits, from Fed economists to Wall Street analysts, saw America’s economy booming into the end of 2023, with projections for full-year GDP growth averaging around 2% (see Figure 2). In fact, amidst a remarkably tight labor market and a seemingly unwavering capacity of American consumers to continue spending, it was that very robustness and hope that the US central bank might have pulled off an elusive soft landing that many saw as giving the Fed confidence to persist in its restrictive policy— even with inflation trending down after six quarters of aggressive rate hikes. Unfortunately, as some pundits have recently noted, calls for a “soft landing” have historically spiked just before the economy turns down (see Figure 3), and we see risk of a Fed overshoot as a potential source of disappointment to investors going into 2024.
Figure 2: Fed’s Various GDP Forecasts Lend Support to Soft Landing Hopes
At the end of September, the FOMC left US interest rates unchanged in what many saw as a “hawkish pause,” with projections in the committee’s third-quarter dot plot showing a central bank intent on keeping policy rates elevated through at least the end of 2024, and possibly longer. One of the things giving the Fed confidence in its flexibility to maintain a restrictive stance is the degree to which the economy has so far absorbed 525 basis points of rate hikes without a hit to growth. Indeed, even throwing out the Atlanta Fed’s often optimistic real-time forecast for this year’s real GDP growth of 4.9%, the average of models and surveys published by three other banks in the Federal Reserve system is a robust 1.9%—definitely in line with a soft landing the bank is hoping to achieve.
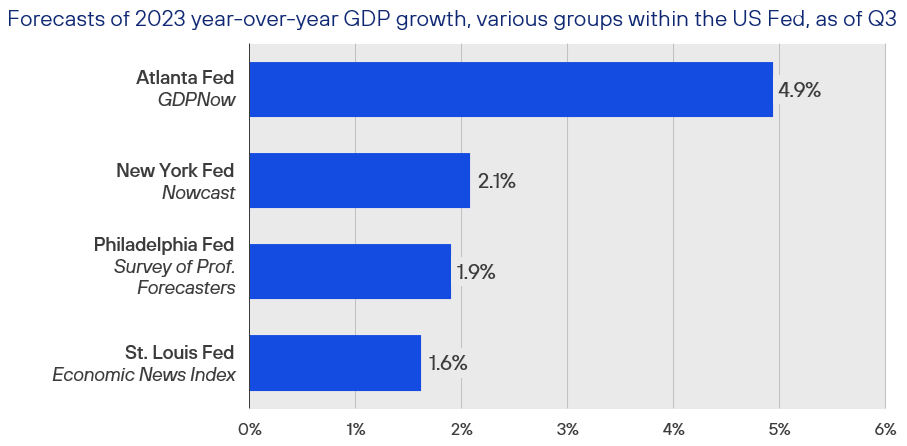
Source: Federal Reserve Banks of Atlanta, New York, Philadelphia, and St. Louis. As of 30 September 2023.
Figure 3: Unfortunately, Calls for a “Soft Landing” Often Precede a Downturn
According to Jeanna Smialek at the New York Times, the term “soft landing” seems to have been coined in the early 1970s to describe a scenario in which the Fed manages to cool the economy down just enough to get inflation back below its 2% target without triggering a recession. In the third quarter, it was impossible to avoid predictions the US economy would enjoy an easy touchdown from the inflationary episode that prompted the most aggressive sequence of rate hikes in recent memory. Sadly, the record of such prognostications is poor, as both large spikes in media mentions of the phrase “soft landing” tallied by Bloomberg over the last three decades have occurred shortly before America entered a recession.
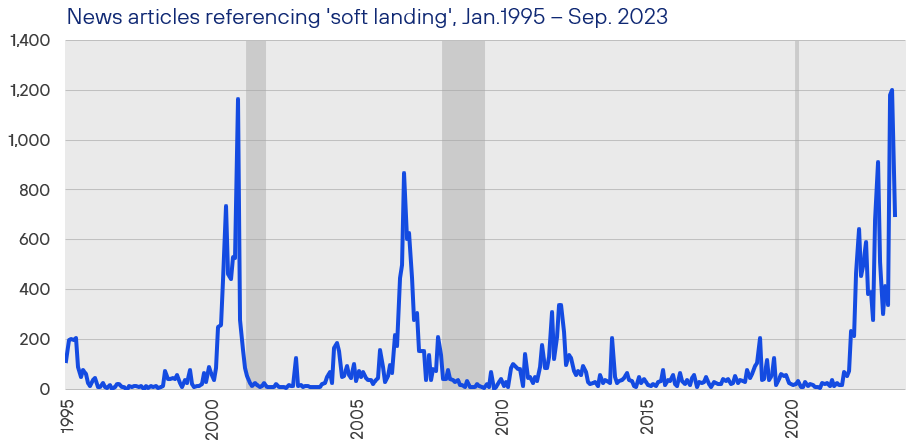
Source: Rayliant Research, Bloomberg, NBER recessions shaded. As of 30 September 2023.
It’s notable, and perhaps a reflection of just how positive sentiment around the US economy has been so far this year, that despite a third-quarter sell-off in risk assets, stocks in the S&P 500 still enter October ahead by 13%, year to date, while the NASDAQ composite, down almost –4% in Q3, closed September up by 27% for the year. Clearly, some of those gains have been predicated on a belief that the Fed had finished with rate hikes and would begin easing as early as the start of next year. As such hopes began to fade over recent months, risk assets have retreated somewhat, although we still view equity investors’ perception of risk as a bit too optimistic. It’s easy to visualize that in the form of the so-called “equity risk premium,” which measures the spread investors demand to hold risky stocks as opposed to parking themselves in super-low-risk government bonds. While stocks have fallen recently, so have estimates of companies’ future earnings, depressing stocks’ yield. Meanwhile, Treasury yields have climbed, such that by the end of Q3, the equity risk premium had been squeezed to its lowest level in over two decades (see Figure 4). With so many risks facing equity investors—from stagflation to war in Europe and the Middle East—we see the current premium as too small, and expect a better entry point in coming months, preferring to overweight much safer fixed income in the meantime.
Figure 4: Equity Investors Require Little Premium, Despite Looming Risks
The difference between the yield on stocks and bonds, referred to as the Equity Risk Premium (ERP), is sometimes seen as a gauge of market sentiment, reflecting the extra return investors require in exchange for bearing the uncertainty associated with stock market investments relative to risk-free government bonds. The ERP often spikes during periods of market stress, though we note that it has been on a downward trend since a brief rise at the outset of the pandemic in early 2020. With S&P 500 stocks offering less than a 0.6% premium over Treasuries at the end of Q3, equity investors seem quite comfortable with a wide range of macroeconomic and geopolitical risks facing stocks as 2023 comes to a close—which makes stocks a little pricey here, in our view.
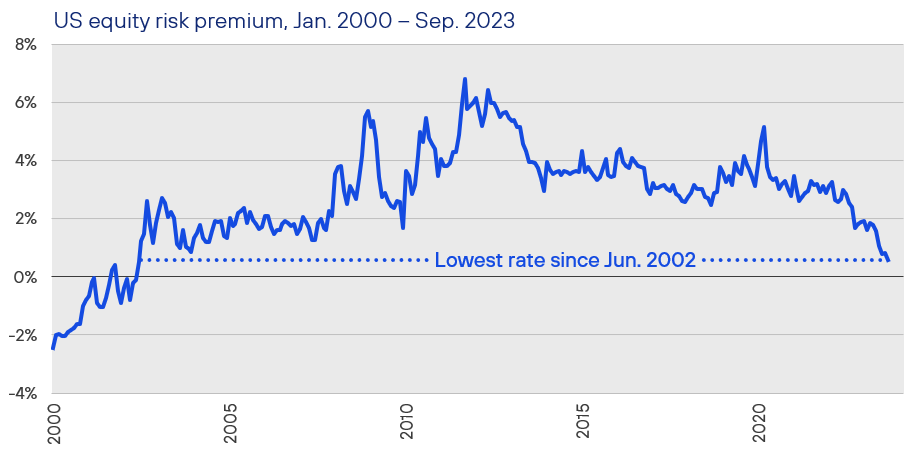
Source: Rayliant Research, S&P 500 forward earnings yield, less 10-year US Treasury yield. As of 30 September 2023.
Fixed Income
Of course, despite its reputation as being safer than equities, fixed income can post losses, too, and it was another trying quarter for bonds, as the US yield curve steepened and this policy cycle’s losses in most segments of the fixed income market continued through September (see Figure 5). Indeed, by the end of Q3, the Bloomberg US Aggregate Bond Index had fallen far enough to make this drawdown, which began in early 2022, the longest (38 months) and deepest (–17%) in the benchmark’s history (see Figure 6). High yield was a notable exception, given its lower sensitivity to interest rates, as were UK corporate bonds, which posted an impressive gain of +2.4% for the quarter as macro data improved and traders speculated the Bank of England’s September pause likely marks a peak. The Fed hiked in July but, like the BoE, chose to skip a move at its September FOMC—though rather than suggesting it was the end of the line for hikes in the Fed Funds rate, members’ quarterly dot plot showed the US central bank actually tending toward one more bump to its policy rate this year, reinforcing a hawkish tone that we believe has been pretty explicit since the Fed got serious on inflation (see Figure 7).
Figure 5: Fixed-Income Market Performance
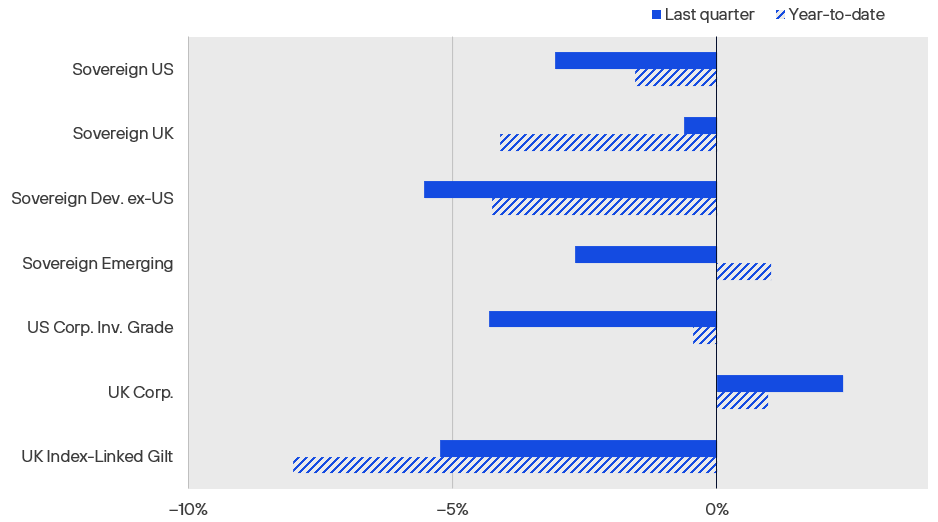
Source: ICE US Treasuries Core, FTSE Actuaries UK Conventional Gilts, S&P Int. Sov. ex-US, JPMorgan EMBI Global Core, iBoxx USD Liquid Inv. Grade, Markit-iBoxx GBP Liq. Corp., Bloomberg UK Gov. Inflation-Linked All Mat., expressed in USD, except for UK indices in GBP, via Bloomberg. As of 30 September 2023.
Figure 6: Bond Index Suffers Longest and Biggest Drawdown on Record
While many equity investors could be heard grousing at quarter end over a moderate Q3 risk-off in stocks—which still left major benchmarks squarely in positive territory, year to date—bond markets were absolutely reeling from a continuation of the longest drawdown in the history of the Bloomberg US Aggregate Bond Index, launched way back in 1976, which is also its deepest, ending September over 17% off its early-2022 peak. Things were even worse for those invested at the long end of the yield curve, a space we have very consciously avoided, with ETFs like TLT and ZROZ, which hold bonds maturing decades from now, down –48% and –61%, respectively, from 2020 highs. We see little relief on the horizon, as strong issuance and weak demand continue to push yields up.
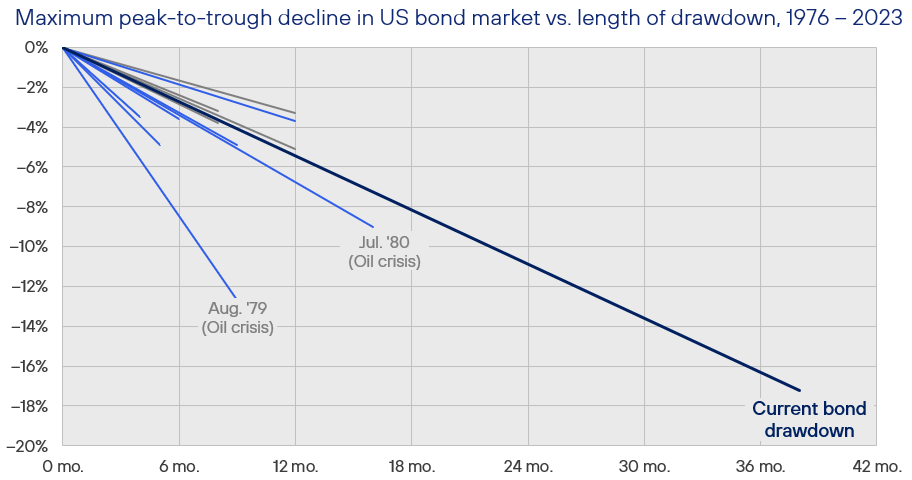
Source: Bloomberg US Aggregate Bond Index, list of bear markets from Charlie Bilello. As of 30 September 2023.
Figure 7: Natural Language Model of “Fedspeak” Shows Tightening Tone
Given how central Fed policy is to many investors’ outlook for financial markets at present, it is no surprise to find traders spending countless hours parsing every word of sometimes-cryptic FOMC transcripts for clues as to the Fed Funds rate’s likely trajectory. Quant researchers at Bloomberg have made this task a bit easier, applying natural language processing to Fed officials’ speech and publishing quantitative scores that measure “hawkish” or “dovish” communications from the central bank. Policy cycles are readily apparent over time, and we see an obvious trend toward a more hawkish tone beginning in late-2020, though we note that despite what could be the start of a plateau in 2023, Fed sentiment hasn’t yet been as restrictive as it was at the peak of past policy cycles.
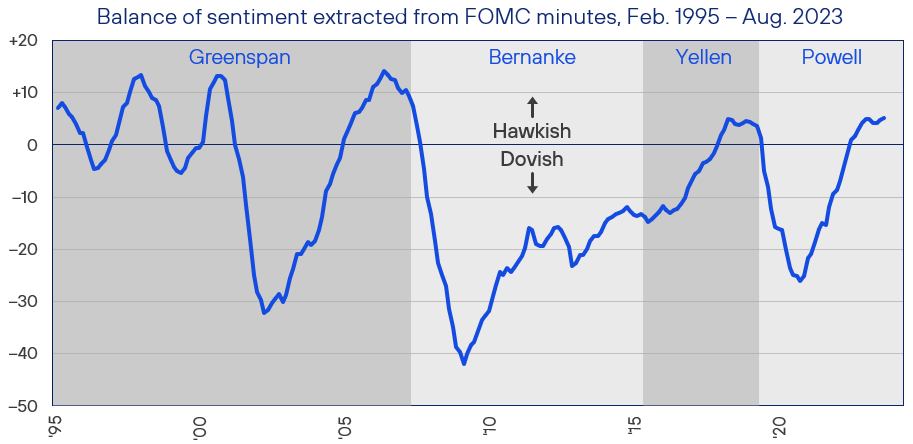
Source: Rayliant Research, Bloomberg, as of 30 September 2023. Hawkish minus dovish sentiment, 12-month moving average.
That said, over the last few months, it hasn’t just been actual rate hikes and increasing expectations the Fed will go higher for longer that have been pushing up Treasury yields. Demand for US sovereign bonds has also taken a hit as a result of uncertainty over the nation’s “fiscal sustainability”—an anxiety which has been punctuated by the narrowly averted US government shutdown back in Q2, an August downgrade of America’s credit by Fitch, and an increasingly dysfunctional US Congress many believe incapable of doing anything but expanding the nation’s already concerning budget deficit. Moreover, the Fed has been quietly implementing quantitative tightening (QT) in the background to pare down its balance sheet; that has the effect of further reducing demand for US government bonds at the same time the Treasury must issue reams of new paper to keep the country running and refill its General Account, depleted by the drama in the second quarter’s installment of America’s seemingly perpetual debt ceiling crisis. Taken together, we see these dynamics as limiting the appeal of longer-duration fixed income, leading us to prefer the front end of the curve.
The Fed is naturally watching all of this play out, as well, and some have speculated that the confluence of factors driving up Treasury yields—which serves to tighten financial conditions without requiring any additional work on the part of the FOMC—might just convince Powell and his associates that policy is restrictive enough where it is, prompting them to hold at this level. In that case, the most important question for investors changes from “How high will rates go?” to “When might we see the Fed shift to easing and put us on the downslope of this policy cycle?” Studying the Fed’s actions over the last four decades reveals a wide range in the length of Fed Funds rate plateaus (see Figure 8). Given an average pause of seven months before cuts ensue, assuming we saw this cycle’s last hike in July, next March’s FOMC meeting could be one to watch. By contrast, we do not anticipate cuts anytime soon and still assign meaningful probability to another hike before this year is out. That leads us to another concern, which involves credit spreads, currently sitting just below their long-term average. The longer Fed policy remains restrictive, the closer firms come to a wall of maturing debt that will be very expensive to roll over, inflicting pain on bondholders and equity investors, alike, in coming years (see Figure 9).
Figure 8: Searching for Policy Clues in Four Decades of Fed Pauses
In addition to scrutinizing the minutes of Fed speeches, much research has focused on the history of FOMC policy decisions in a search for precedents that might predict when this policy cycle might turn. A simple analysis of past tightening campaigns since the early 1980s reveals a Fed ‘pause’ before hikes give way to cuts can be as short as two months—as it was in the second quarter of 1984, when Paul Volcker’s Fed did a U-turn to avoid recession—or extend for more than a year, as observed when a 2006 reprieve from rising rates only shifted to easing after the property bubble burst in late-2007. If July turns out to be the last hike, and if the current pause matches its past average of seven months, next year’s March FOMC could be an interesting one.
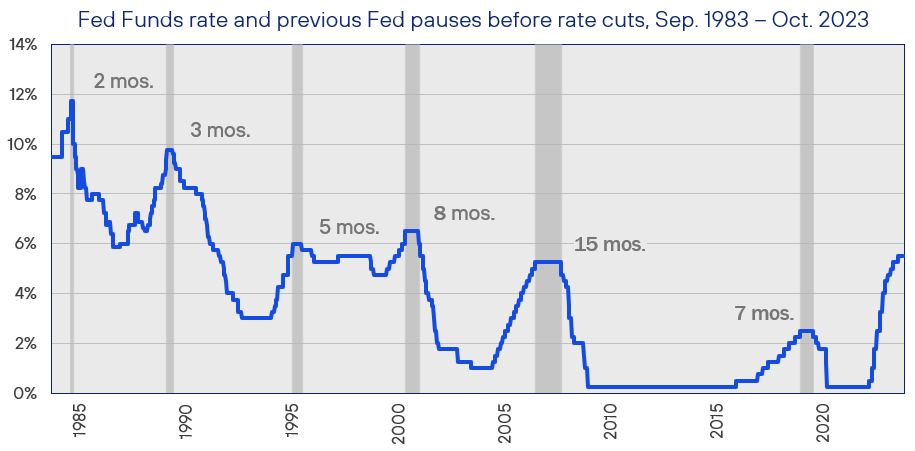
Source: Rayliant Research, US Federal Reserve. As of 10 October 2023.
Figure 9: Debt Wall Expected to Unleash Pain of Higher Rates
One reason Fed rate hikes seem to have inflicted little pain, thus far, on the US economy is that firms were quite effective in locking in long-term borrowing at low rates before restrictive policy set in. As such, there hasn’t been much need to refinance at significantly higher rates in 2023. Surveying S&P 500 firms’ balance sheets outside the Financial industry, the good news is that nearly half of debt won’t mature until after 2030: plenty of time for the Fed to get monetary policy onto easier terms. The bad news is that broadening out to the rest of the economy, Goldman Sachs estimates nearly US$2 trillion in debt will come due in 2024 and 2025, which the bank’s analysis suggests will result in large reductions in companies’ capital expenditures over the next few years.
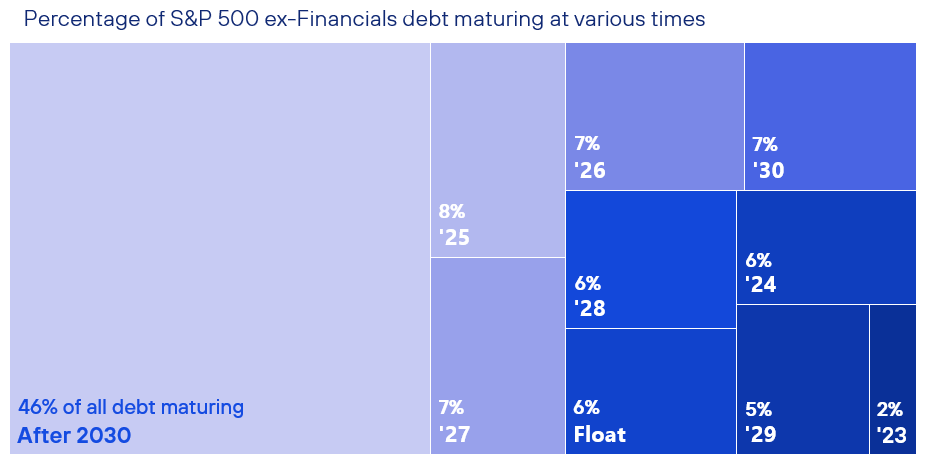
Source: Goldman Sachs. As of Q3 2023.
Alternatives
The biggest story in alternatives space in Q3 was the outperformance of commodities, centered within the energy sector and driven by surging oil prices, as crude climbed by nearly 27% for the quarter (see Figure 10). Behind the steep rise in energy prices was an early-September announcement by Russia and Saudi Arabia of extensions to oil production cuts that will reduce supply by 1.3 million barrels/day, adding to 1.7 million barrels/day in output cuts to which members of the OPEC+ coalition had already committed. Oil producing nations seem intent on setting a floor below oil north of $90/barrel, a level at which they’re apparently more comfortable balancing their fiscal needs—and with its invasion of Ukraine dragging on, Russia has special motivation to angle for higher energy prices in the near-term. An unfortunate upshot of rising oil prices is the inflationary pressure it exerts, along with the risk higher costs stress consumers’ budgets further, dampening spending on other things. It’s also worth noting that potential stressors exist on the demand side, as well, including the eventual replenishment of the US Strategic Petroleum Reserve (see Figure 11) and what we see as an inevitable recovery in China’s appetite for the commodity.
Figure 10: Alternatives Performance
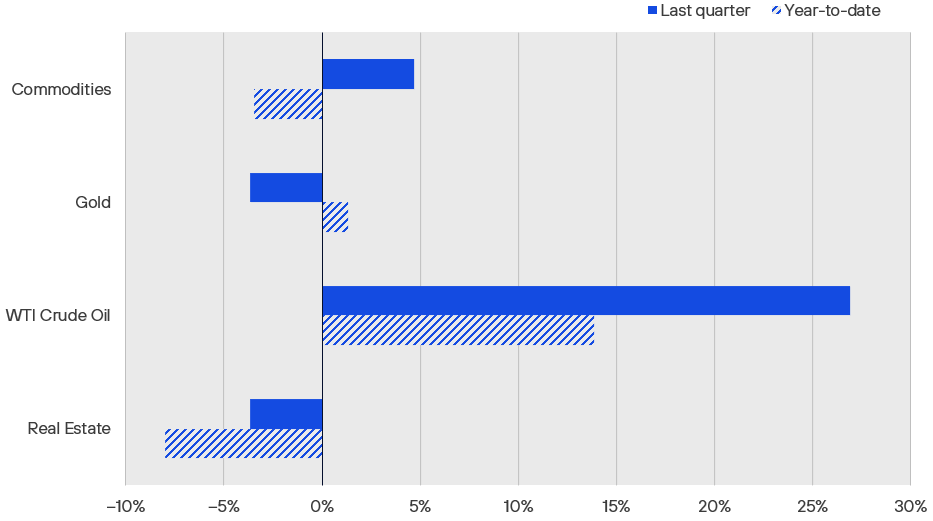
Source: Bloomberg Commodity Index, Gold Spot, WTI Crude, iShares International Developed Real Estate ETF, all expressed in USD, via Bloomberg. As of 30 September 2023.
Figure 11: US Emergency Oil Stocks Sink to 40-Year Lows
The US Strategic Petroleum Reserve (SPR), a rainy-day oil reservoir motivated by the 1973 OPEC embargo, began filling up back in 1977, reaching a peak of nearly 727 million barrels at the end of 2009. Beginning in 2015, with domestic oil production making the US less dependent on imports, Congress planned a large sell-down of the SPR through 2028: plans which were accelerated by President Joe Biden, who authorized a 217 million barrel draw on reserves in late-2021 to mitigate a spike in energy costs stemming from Russia’s invasion of Ukraine. That leaves America’s emergency inventories as low as they’ve been in over 40 years—and makes any future plans to refill the SPR one more contributor to an oil demand that already seems out of sync with supply.
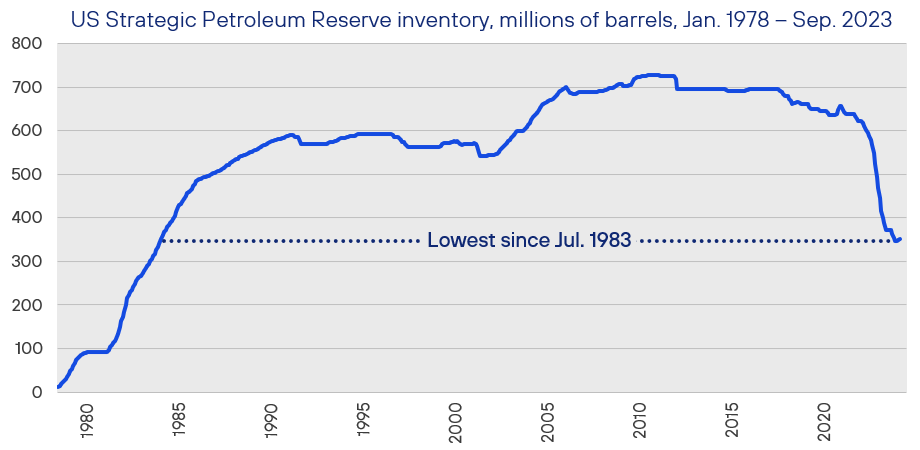
Source: Rayliant Research, Federal Reserve Bank of Dallas, Energy Information Administration. As of 30 September 2023.
Turning to real estate, it is probably not surprising that in a quarter characterized by anxiety over rising rates, property investments also sold off, with international developed real estate falling –3.7% for the three months ending in September, putting year-to-date losses at –8%. Commercial real estate continued to struggle, as tight financial conditions, uncertainty over Fed policy and the risks associated with commercial debt coming due for refinancing in the next few years, as well as post-pandemic trends—notably in the office sector—led to a reduction in property investors’ risk appetite. That said, fundamentals in many sectors remain good, with retail vacancies relatively stable and hotels actually posting decent numbers amidst an ongoing resurgence in travel. Conditions were especially good in Q3 for sellers in the US single-family market, where the persistent tightness in supply of existing homes afforded owners downside protection, as the National Association of Realtors’ Housing Affordability Index fell to its lowest level on record (see Figure 12). These odd dynamics likely further complicate economists’ work parsing data on shelter costs in an effort to determine when this important component of US CPI will finally begin to soften.
Figure 12: As Mortgage Rates Approach 8%, Housing Affordability Takes a Hit
In the US residential real estate market, one of the biggest stories in 2023 has been a massive drop in Americans’ ability to afford a home, with many first-time buyers simply priced out of the market. High mortgage rates are partly to blame; the Mortgage News Daily recently reported a national average on 30-year fixed mortgages above 7.7% at the start of October. Unfortunately, high rates have been compounded during this cycle by unusually tight supply, as homeowners with loans locked in at ultra-low rates are compelled not to sell and new builds won’t fill the gap fast enough. This dynamic has cratered the National Association of Realtors Housing Affordability Index, which reached a record low at the end of Q2, hitting 92.7—below where it launched back in 1986.
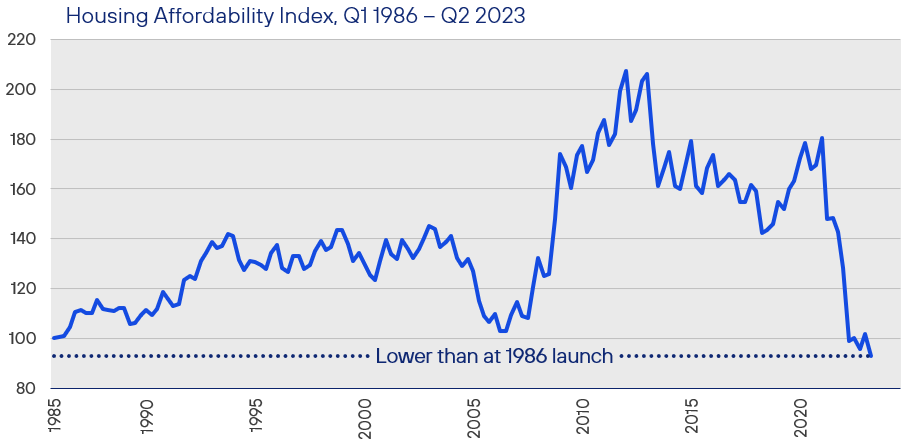
Source: Rayliant Research, National Association of Realtors. As of 30 June 2023.
Endnote
1At time of writing, 23 October 2023, all our main strategies are outperforming their benchmarks.
Economic Calendar
Key Economic Releases and Events for 2023 Q3
United Kingdom
Bank of England Official Bank Rate Release: 2nd Nov., 14th Dec.
GDP Figures: 10th Nov., 22nd Dec.
PMI Figures: 24th Oct., 23rd Nov.
CPI Figures: 10th Oct., 15th Nov., 20th Dec.
Eurozone
ECB Monetary Policy Meeting: 26th Oct., 14th Dec.
GDP Figures: 31st Oct.
PMI Figures: 24th Oct., 23rd Nov.
CPI Figures: 18th Oct., 17th Nov., 19th Dec.
United States
FOMC Rate Decision: 1st Nov., 13th Dec.
GDP Figures: 26th Oct., 29th Nov., 21st Dec.
PMI Figures: 1st Nov., 1st Dec.
CPI Figures: 14th Nov., 12th Dec.
Important Information
The information contained in this article is the opinion of Henderson Rowe and does not represent investment advice. The value of investment may go up and down and investors may not get back what they invested. Past performance is not an indicator of future performance.
This document is intended for the use and distribution to all client types. It is not intended for distribution to, or use by, any person or entity in any jurisdiction where such distribution would be unlawful and participation in the portfolio referred to herein shall not be offered or sold to any person where such sale would be unlawful. Any onward distribution of this factsheet is strictly prohibited.
The value of investments and the income from them can go up as well as down and you may realise less than the sum invested. Some investments may be subject to sudden and large falls in value and you may realise a large loss equal to the amount invested. Past performance is not an indicator of future performance. If you invest in currencies other than Sterling, the exchange rates may also have an adverse effect on the value of your investment independent of the performance of the company. International businesses can have complex currency exposure.
Nothing in this document constitutes investment, tax, legal or other advice by Henderson Rowe Limited. You should understand the risks associated with the investment strategy before making an investment decision to invest.
Investors should be aware of the risks associated with data sources and quantitative processes used in our investment management process. Errors may exist in data acquired from third-party vendors, the construction of model portfolios, and in coding related to the index and portfolio construction process. Information contained in this fact sheet is based on analysis of data and information obtained from third parties. Henderson Rowe Limited has not independently verified the third-party information. The firm, its directors, employees, or any of its associates, may either have, or have had, a position, holding or material interest in the investments concerned or a related investment.
Henderson Rowe is a registered trading name of Henderson Rowe Limited, which is authorised and regulated by the Financial Conduct Authority under Firm Reference Number 401809. It is a company registered in England and Wales under company number 04379340.


