Market Commentary

Quarterly Commentary

Summer 2020

Market Overview

Investors will remember the beginning of 2020 for a long time. Regardless of how the situation unfolds the rest of the year, we know that most of us have not seen such volatile markets for a very long time. In fact, for those who started investing after 2008, this is the first experience with a bear market. Back in March, the market signalled that the global economy was on the brink and a liquidity crisis threatened an avalanche of insolvencies and bankruptcies. Central banks stepped in quickly, boosting and maintaining liquidity in Treasury and corporate bond markets. This support, combined with a range of coordinated fiscal stimuli around the globe, allowed the markets to find the bottom and stage one of the sharpest short-term rallies in history.

Taking the behaviour of stock markets as an economic indicator, one might get the impression that the world economy is in a good place right now. Unfortunately, it is the exact opposite. The global economy today finds itself in a crisis not yet witnessed in the 21st century. US unemployment increased from 4% to 14% in just under two months, and the UK’s real picture is likely to emerge after the end of the furlough program in September, but already expected to come in at close to 15%. All developed countries have implemented various fiscal stimulus programs aimed at maintaining consumption. Still, it is difficult to say what the long-term effects of these measures will be and whether consumer appetites for spending can return to pre-crisis levels. Only time will tell. For now, the market—or at least the technology sector—tells a positive story.

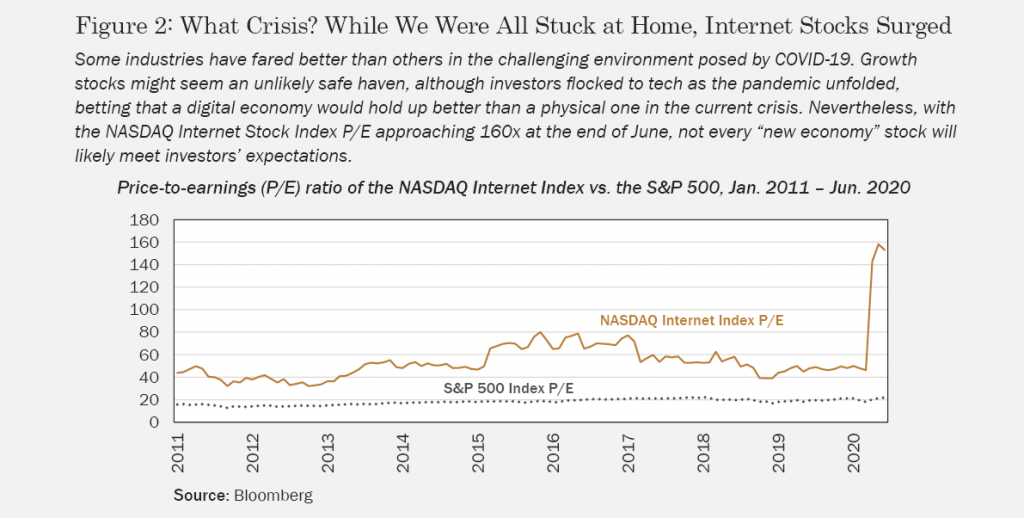
One of the most critical consequences of the COVID crisis is an acceleration of the automation—or, as it has been called, the “de-humanisation”—of the corporate world. Fewer humans means higher margins, limited pension liabilities and almost perfect resource efficiency. The software sector seems to be the only one that matters, and it has infiltrated nearly every industry on the planet. E-commerce, autos, TV, education and even farming rely on some software and, more importantly, require less human input. No wonder NASDAQ is up 17% year to date, and almost 40% since its March lows. Everyone wants to be on the tech bandwagon.

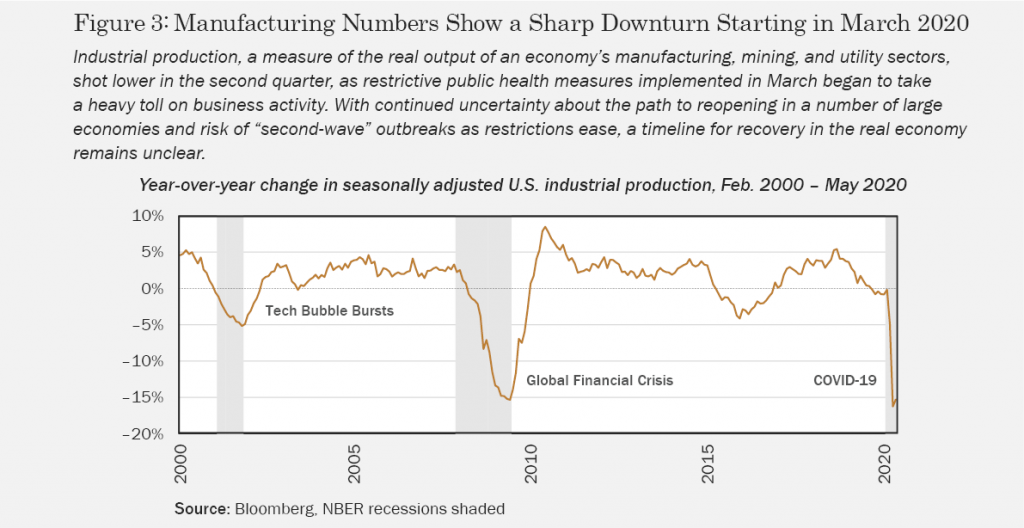
Sharp stock market rallies have a unique tendency to create a gambling mentality in retail investors’ minds. The Tech Bubble, Global Financial Crisis and the Bitcoin rally in 2018 all share one similar feature: retail investors piling in at the top. High levels of greed usually lead to “this time is different” thinking. New valuation tools, often not based on cash flows, are introduced by market participants to justify buying overvalued stocks. Reasons given as to why markets and businesses have changed are often based on farfetched narratives. Nevertheless, as more and more retail investors make more and more money, the mania continues. Every day the market rallies, remaining critics are proven wrong and not participating in the bubble becomes psychologically and financially painful. Everyone hopes they will sell at the top, but history tells us few will manage to do so.

This isn’t to say the world is in a bubble, though certain corners of the market are beginning to flash “bubble-like” characteristics that should concern us. Big tech’s growth is robust, to be sure, and its long-term prospects are promising. For many software businesses, the pandemic is undoubtedly a game-changer, forcing consumers to embrace an “online” way of life. Speculation these days tends to appear in single names or subsectors. Cannabis stocks, new-era auto stocks, single-product companies—the list is long. Every good analyst knows that a stock’s price reflects a mix of its discounted cash flow valuation and the optionality of selling it to someone else at a higher price. Our job is to find the ones that are a mix of both and avoid the ones trading purely on the latter: so-called “narrative stocks”. Should an auto manufacturing company which has a negative cash flow and less than 1% of global sector revenues trade higher than all other auto manufacturers combined, implying decades of near-monopoly? Maybe, but with fundamentals saying otherwise current shareholders are betting on the greater fool theory.

There is nothing wrong with speculating on one’s own account. As long as one understands the risk, doesn’t speculate with most of one’s savings and knows speculation is not investment, losses should be limited. The problem starts when the greater fool theory begins to dominate investment decision making, and one’s main portfolio moves away from a well-diversified selection of investments towards a handful of stocks picked based on charismatic CEOs and sexy narratives. As the world struggles under the weight of a pandemic and the company’s shares are at an all-time high, that charismatic CEO you were so excited about is already working on the exit strategy…are you?

Asset Classes

Equities

Almost as rapidly as COVID-19 shut down the global economy and sent markets into a panic at the end of March, investors’ optimism returned in the second quarter. While trillions of dollars in support from governments and central banks certainly didn’t hurt, data pointing to successful containment of coronavirus in some of the hardest-hit countries, easing of restrictions on mobility and a resumption of trade, a variety of economic reports suggesting the beginnings of a recovery, and even potentially good news from early vaccine trials all contributed to stocks soaring in Q2. US shares led among major markets, adding 20.5%—bringing the S&P 500 to within a few percentage points of breakeven for the year—while EM stocks rallied by 18.2%, European equities gained 10.8%, and badly battered UK stocks recovered by 10.2%, still down roughly –17.5% in 2020 (see Figure 1).

In fact, looking only at the performance of the tech-heavy NASDAQ market during the second quarter—which hit an all-time high in June—one would be hard pressed to infer we were in the midst of public health and economic crises the American Congressional Budget Office estimates will reduce real US economic output by $7.9 trillion over the next decade. One important lesson for investors in the current environment has been the value of diversification with respect to geography and industry. Throughout the pandemic, growth stocks associated with the Internet economy have flourished, with consumers increasingly spending online and companies with recurring revenues from digital subscriptions seeing minimal disruption from the lockdowns and social distancing measures that have been so disastrous for industries like airlines and hospitality.

Of course, in order to outperform, an investor must see value others don’t. In that sense, the price tag on NASDAQ Internet stocks, which jumped from a P/E ratio of less than 50x at the beginning of January to nearly 160x in late-June (see Figure 2), implies consensus expectations for extremely strong growth, a significant degree of upside already “priced in”, and the likelihood that some high-flying tech stocks will disappoint going forward. This logic applies to equities more generally as we enter Q3, with stocks continuing to rebound and valuations nearing pre-pandemic levels. Equity investors might expect a recovery, but forecasts are inherently uncertain. What we do know is that COVID-19 has profoundly impacted output through the second quarter (see Figure 3), and the risk of future public health setbacks and a return to the severe countermeasures of March and April—as we appear to be seeing in many US states—could result in further economic damage.

Few are better positioned to assess the past and future effects of the pandemic on business than managers, themselves. In a study published in May, Andrew Chen and Jie Yang, economists at the US Federal Reserve Board of Governors, applied textual analysis to over 3,000 transcripts from public firms’ earnings conference calls, looking for language that might reveal corporate insiders’ perspectives on economic conditions and risk (see Figure 4). Chen and Yang found that April calls showed a sudden jump in manager mentions of credit line drawdowns, dividend and share repurchase program cuts, and reduced reinvestment—all clear signs of insiders’ apprehension about business conditions in Q2, despite apparent optimism on the part of the investing public. Perhaps reflecting a sensitivity to stock traders’ latent doubt, managers reporting to shareholders in April were also more likely to boast of strong balance sheets. While talk on company conference calls is surely cheap, equity investors might be wise to focus on quality fundamentals, in addition to growth, while searching for opportunity in stock markets rallying against a backdrop of profound risk.

Fixed Income

After the first quarter’s flight to quality, coordinated rate cuts, and bond purchases that saw central banks’ balance sheets bulge—the US Fed increased its assets from $4 trillion at the beginning of the year to over $7 trillion by the end of June—developed sovereign debt had a quieter three months to end the first half of 2020. Instead, most of the action in Q2 was concentrated in riskier EM sovereign and developed corporate issues, as bond investors displayed a greater appetite for higher-yielding debt (see Figure 5). While US, UK, and developed ex-US sovereign bonds saw modest gains of 0.2%, 2.5%, and 3.6%, respectively, EM sovereign debt added 12.9%, US investment grade corporate bonds returned 9.7%, and UK corporates advanced by 10.0% for the quarter. A rally in oil prices and increased expectations for inflation saw a jump in the price of index-linked gilts, as well, up 10.6% for the quarter.

An interesting feature of debt markets in the second quarter was the breathtaking amount of issuance, not only by governments financing massive stimulus programs, but also by firms establishing reserves to see them through prolonged economic disruption as the pandemic drags on. US investment grade issuers had already raised $1 trillion by the end of May, according to Bloomberg, easily setting a record with respect to the speed with which corporate borrowers hit that milestone. At the same time, US issuers were hitting a less inspiring high, this time in terms of the ratio of S&P Credit downgrades to upgrades, with 1,628 downgrades through the first two quarters, and only 162 upgrades (see Figure 6). An expanding list of household names has joined the ranks of “fallen angels”—companies slashed from investment grade to “junk” ratings—including Ford, Renault, Kraft Heinz, and British Airways.

Typically, such a wave of downgrades would predict higher future default rates. Despite that, high-yield credit spreads, which spiked in late March at the height of pandemic panic, have since declined, suggesting investors feel safer holding risky bonds today than they did a few months ago (see Figure 7). Bondholders will no doubt be comforted by central banks’ willingness to support credit markets; in June, the Fed announced that it had extended its bond purchases to corporate debt. Even so, the inevitable overhang created by this emergency issuance could ultimately hinder future earnings growth, as debt servicing crowds out investment.

Alternatives

After the worst quarter on record for oil to start the year, continued low demand and an oversupply of oil at the pipeline hub in Cushing, Oklahoma at the end of April resulted in a bizarre situation in which West Texas Intermediate crude futures fell to negative prices for the first time in history. Indeed, to put the full impact of COVID-19 on energy markets into perspective, consider that despite oil rebounding by a staggering 180.5% in Q2 on the strength of greater hope for economic recovery and an end to the OPEC-Russia price war, the commodity is still off by –36.5% this year (see Figure 8). Elsewhere among alternative assets, low interest rates and investors’ anxiety over the pandemic extended gains in gold by 12.9%—the safe haven asset is now up 17.4% for the year—while a thaw in the real estate market on easing restrictions helped properties to a modest 8.5% recovery for the quarter.

Since March, when governments around the world began spending money as fast as they could borrow it to combat the immediate adverse economic effects of the pandemic, many investors have wondered whether it might be time to start worrying about inflation again and, if so, what might be done about it at the level of one’s asset allocation. In the short-run, the COVID-19 shock to consumer demand and energy prices will serve as a deflationary influence on prices. Nevertheless, there are valid causes for concern over inflation in the longer term, including not only the obvious potential impact of a multi-trillion-dollar fiscal stimulus explicitly directed at putting money in consumers’ pockets, but also the prospect of “catch-up consuming”, which would add pressure to already-stressed production, and mounting support in many countries for less trade and the elimination of complicated supply chains in favor of domestic production, which would inevitably lead to rising costs.

In response to such concerns, alternative assets like real estate and commodities are often cited as a potential hedge against rising prices. Does that intuition bear out in the data? To answer that, we compiled returns for various asset classes over a five-year period from 1977 to 1981—the last serious episode of inflation in the US, when prices rose an average of 10% per year—as well as during the following four decades, which saw subdued inflation, averaging just 2.7% per year (see Figure 9). While stocks and bonds meaningfully underperformed their long-run averages during high-inflation years, alternatives did fare much better, with REITs returning slightly more than usual, and commodities actually outpacing the CPI. Unfortunately, as with any insurance policy, protection against inflation can be costly. Common stocks clearly won out in times of normal inflation, while commodities delivered roughly half the return on humble bonds during the last 38 years waiting for inflation to reemerge. The upshot of this admittedly simple analysis is that an investor’s best defense against inflation might ultimately be a long-term perspective and a well-diversified asset allocation.

Looking Ahead

Our review of major asset classes revealed markets experiencing a V-shaped rebound, despite a public health crisis and its economic fallout appearing anything but over. Even as risks abound and a number of stocks have rallied over 40% from the bottom of their March sell-off, we still see opportunities in global equities for investors focused on quality and attuned to a challenging macro environment. The Technology and Healthcare sectors were two of those recording positive earnings growth last quarter in the US, while Telecom and Healthcare were the only two sectors growing in the UK. And yet, some companies in these sectors will have room to run, especially if COVID-19 makes a resurgence as lockdowns are lifted. On the other end of the spectrum, Oil & Gas, Consumer Services, Financials and Industrials are all down double or high single digits, year to date. While select names in these sectors will turn out to be value traps, others will likely offer excellent risk/return profiles and could find their way into our portfolio. Making the right call on stocks in a volatile market requires data. As we saw in the analysis of earnings conference calls referenced in our review of equities in Q2, some of the most useful information will come when firms’ managers describe what they’re seeing. To that end, while third-quarter earnings season is likely to show more pain for “old economy” sectors, it could also reveal signs of life surprising on the upside. Ultimately, the most significant alpha opportunity tends to be in assets and markets written off by most market participants.

Key Economic Releases & Events for Q3 2020

UNITED KINGDOM
Bank of England Official Bank Rate: 8th August, 17th September
PMI Figures: 24th July, 21st August, 23rd September

EUROZONE
YoY GDP: 31st July, 31st August, 23rd September
PMI Eurozone: 24th July, 21st August, 23rd September
Unemployment Report: 30th July, 28th August, 22nd September
ECB Monetary Policy Meeting: 16th July, 10th September

UNITED STATES
FOMC Rate Decision: 29th July, 16th September
GDP Figures: 30th July, 27th Aug, 30th September
PMI Figures: 24th July, 21st August, 23rd September

Closing Comments

Investors often extrapolate rates of return on indices or even single stocks well into the future—sometimes, all too well. Double-digit annual rates of return are unlikely to repeat themselves over the short to medium term, especially at current valuations and under today’s economic conditions. There is little doubt that many big tech businesses are relatively well-positioned to benefit from economic growth over the long run. However, this doesn’t mean stock prices in these businesses will keep rising, and certainly not at the pace some witnessed in the second quarter rebound. If the recent rally priced in, say, the next 10 to 15 years of growth, investors might need to look at other areas offering a better risk-adjusted return. Don’t worry, though: achieving that outcome doesn’t require that one sell off their favourite tech stock. By simply taking smaller positions and including other uncorrelated investments with different risk profiles in one’s portfolio, an investor can keep exposure to select narrative stocks while limiting some downside risk. This is one of the reasons we use modest fixed position sizing when building our portfolios, diversifying across geographies, sectors and factors. Such an approach gives us exposure to upside in the broad market, while offering a chance to capture outperformance in areas that might be currently under the radar of other market participants. Wherever those stocks turn out to be, after what we’ve seen so far in 2020, the second half is bound to be interesting for investors.

IMPORTANT INFORMATION

This publication does not constitute a financial promotion as defined by Section 21 of the Financial Services and Markets Act 2000 (FSMA).

This document is intended for the use and distribution to all client types. It is not intended for distribution to, or use by, any person or entity in any jurisdiction where such distribution would be unlawful and participation in the portfolio referred to herein shall not be offered or sold to any person where such sale would be unlawful. Any onward distribution of this factsheet is strictly prohibited. The value of investments and the income from them can go up as well as down and you may realise less than the sum invested. Some investments may be subject to sudden and large falls in value and you may realise a large loss equal to the amount invested. Past performance is not an indicator of future performance. If you invest in currencies other than Sterling, the exchange rates may also have an adverse effect on the value of your investment independent of the performance of the company. International businesses can have complex currency exposure. Nothing in this document constitutes investment, tax, legal or other advice by Henderson Rowe Limited. You should understand the risks associated with the investment strategy before making an investment decision to invest.

Investors should be aware of the risks associated with data sources and quantitative processes used in our investment management process. Errors may exist in data acquired from third-party vendors, the construction of model portfolios, and in coding related to the index and portfolio construction process. Information contained in this fact sheet is based on analysis of data and information obtained from third parties. Henderson Rowe Limited has not independently verified the third-party information. The firm, its directors, employees, or any of its associates, may either have, or have had, a position, holding or material interest in the investments concerned or a related investment.